Freedom251 › Game Profiling Software
Tracy Profiler
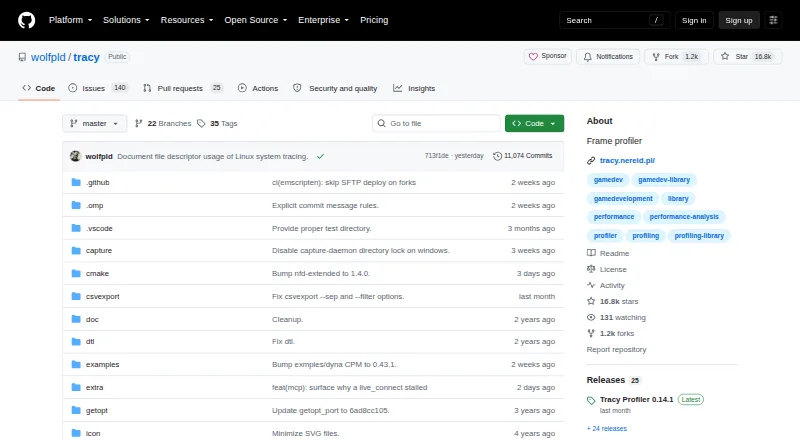
What Tracy Profiler is
Tracy Profiler is a free profiler for games and other applications, built for remote telemetry with nanosecond resolution. It provides CPU profiling integrations for C, C++, Lua, Python, and Fortran, and GPU profiling for OpenGL, Vulkan, Direct3D 11/12, Metal, OpenCL, CUDA, and WebGPU. It can capture memory allocations, locks, context switches, and screenshots associated with frames. Third-party bindings are listed for languages including Rust, Zig, C#, OCaml, and Odin. A capture daemon can discover Tracy clients over UDP and save each capture separately; a merge tool combines traces from multiple processes. Merged traces retain zones, messages, and plots, but omit GPU zones, memory events, and call stacks. Sampling can heuristically reconstruct zone call stacks. An optional assistant integration analyzes captured data using llama.cpp models; local setup is required, and the project says local activity stays private. Tracy is licensed under the 3-clause BSD license. Prebuilt profiler binaries are available for Windows, macOS, and Linux, with other supported platforms also listed.
Who it suits
Tracy suits developers profiling games and other applications, especially those working with CPU, GPU, memory, or remote telemetry data.
What it does well
- Free under the 3-clause BSD license.
- Supports CPU profiling integrations for five named languages.
- Supports a broad set of GPU APIs.
- Captures memory, locks, context switches, and frame screenshots.
- Capture daemon discovers clients over UDP.
What to know first
- Merged traces omit GPU zones, memory events, and call stacks.
- Assistant integration requires local setup.
- Prebuilt profiler binaries are listed for Windows, macOS, and Linux.
Limits
Trace merging preserves zones, messages and plots but drops GPU zones, memory events and call stacks. The assistant integration requires local setup.
Plans
| Plan | Billed and limits | Price |
|---|---|---|
| Tracy Profiler | 3-clause BSD license | Free |
As github.com lists them, read 30 Sept 2026. The maker's own page has the final word.
Getting started
- Visit the Tracy GitHub repository.
- Review the tracy.pdf documentation included with releases.
- Choose a supported platform; prebuilt profiler binaries are listed for Windows, macOS and Linux.
- For automated capture, use the daemon that discovers clients over UDP.
- For assistant analysis, set up the integration locally.
Tracy Profiler is a free, open-source profiler for games and other applications, aimed at developers who need detailed CPU, GPU, and runtime telemetry. Its broad instrumentation and automated capture make it a strong fit for investigating performance across processes, provided the limits of merged traces suit your analysis.
Overview
Tracy combines remote telemetry with frame and sampling profiling at nanosecond resolution. It goes beyond frame timing to capture memory allocations, locks, context switches, and screenshots associated with captured frames, giving developers several kinds of runtime activity to examine in one profiler.
The 3-clause BSD license permits use under its terms, and the license names Bartosz Taudul as copyright holder for 2017–2026. GitHub releases include a PDF manual and compiled Windows x64 binaries; prebuilt profiler binaries are also available for macOS and Linux.
Key features
CPU and GPU coverage
Direct CPU profiling integrations cover C, C++, Lua, Python, and Fortran. The project points to third-party bindings for Rust, Zig, C#, OCaml, Odin, and other languages, but those are not direct integrations. GPU profiling spans OpenGL, Vulkan, Direct3D 11 and 12, Metal, OpenCL, CUDA, and WebGPU, making Tracy relevant to projects using varied graphics and compute APIs.
Capture and trace analysis
Tracy supports remote profiling, and its 0.14 capture daemon discovers clients over UDP and saves each capture to a separate file. That can reduce manual work when collecting traces from multiple processes. A companion merge tool combines those traces, but the merged result preserves zones, messages, and plots while dropping GPU zones, memory events, and call stacks. It is useful for a combined view of some activity, not a complete record of every captured category.
When sampling is enabled, heuristic reconstruction can rebuild zone call stacks. An assistant integration uses llama.cpp models to analyze captured data and runs locally after setup; its activity stays on the user's system. The 0.14.1 release also hardened protocol string-length encoding.
Pricing
Tracy Profiler costs nothing under the 3-clause BSD license. There is no free trial because the software is free. This suits individuals and teams seeking a profiler without a subscription; the trade-off is that users must work with the project's capture and trace model rather than choosing among service tiers.
Platforms
Supported platforms include Windows, Linux, Android, FreeBSD, WSL, macOS, iOS, and QNX. Prebuilt profiler binaries are available for Windows, macOS, and Linux. That gives desktop developers a direct starting point, while support for other platforms broadens where Tracy can fit into a development workflow.
Who it's for
Tracy is best suited to developers of games and other applications who need fine-grained frame, CPU, GPU, or runtime telemetry, especially when remote or automated collection matters. Its breadth is valuable for complex traces, but teams that depend on merged GPU, memory, or call-stack data should account for those omissions before centering their workflow on multi-process merging.
Pros and cons
- Pro: CPU integrations and GPU API coverage span a wide range of languages and graphics or compute workloads.
- Pro: Memory, locks, context switches, and frame-associated screenshots add context beyond timing data.
- Pro: The UDP capture daemon automates collection from discovered clients, while the local assistant can analyze captures without sending its activity elsewhere.
- Con: Trace merging drops GPU zones, memory events, and call stacks, so a merged trace may omit important evidence.
- Con: Several language options rely on third-party bindings rather than direct integrations.
Alternatives
For a wider set of game profiling options, browse Game Profiling Software. Choose Arm Performance Studio instead if you want a free suite focused on profiling Arm CPU and GPU applications. GFXReconstruct is a free alternative for graphics API capture and replay rather than Tracy's broader telemetry scope. Consider GameBench if its Pro trial—30 minutes of Pro testing and unlimited sessions for 28 days—fits your evaluation needs. CRYENGINE, Orx, Cocos Creator, MicroProfile, and Optick are other alternatives to compare.
Verdict
Choose Tracy if you need a free profiler with broad CPU and GPU coverage, additional runtime telemetry, and automated remote capture. Its main advantage is the range of data it can collect; look elsewhere or validate your workflow carefully if merged multi-process traces must retain GPU, memory, or call-stack details.
Verdict
Tracy covers CPU and GPU profiling alongside other captured telemetry, with tools for automated capture and multi-process trace merging. Check the merge omissions before relying on combined traces for GPU, memory, or call-stack data.
Questions
How much does Tracy Profiler cost?
Tracy Profiler is free under the 3-clause BSD license.
Which platforms does Tracy support?
Supported platforms include Windows, Linux, Android, FreeBSD, WSL, macOS, iOS and QNX. Prebuilt profiler binaries are listed for Windows, macOS and Linux.
Which programming languages have direct CPU profiling integrations?
Direct integrations are listed for C, C++, Lua, Python and Fortran. The project also points to third-party bindings for languages including Rust, Zig, C#, OCaml and Odin.
What data can Tracy profile?
It can profile CPU and GPU activity, memory allocations, locks and context switches. It can also associate screenshots with captured frames.
What information is lost when traces are merged?
Merged traces keep zones, messages and plots, but GPU zones, memory events and call stacks are lost.
Can the assistant analyze data privately?
The assistant uses llama.cpp models and runs locally after setup. The release notes say local activity stays private.
Facts from Tracy Profiler's own pages
- AI assistant
- The release notes describe an assistant integration that can run locally and analyze captured data; they state local setup is required and that running it locally keeps activity private. · github.com, 29 Sept 2026
- Assistant integration
- The 0.14 release notes describe an LLM assistant integration using llama.cpp models and captured Tracy data for analysis. · github.com, 30 Sept 2026
- Automated capture
- The 0.14 release added a capture daemon that discovers Tracy clients over UDP and captures each to its own file. · github.com, 30 Sept 2026
- CPU profiling
- It directly supports CPU profiling integrations for C, C++, Lua, Python and Fortran. · github.com, 30 Sept 2026
- Distribution
- GitHub releases include the user documentation as tracy.pdf and compiled Windows x64 binaries. · github.com, 29 Sept 2026
- Downloads
- The repository's releases provide the Tracy PDF documentation and compiled Windows x64 binaries as assets. · github.com, 30 Sept 2026
- GPU profiling
- It supports GPU profiling through OpenGL, Vulkan, Direct3D 11/12, Metal, OpenCL, CUDA and WebGPU. · github.com, 30 Sept 2026
- Intended users
- The project describes Tracy as a profiler for games and other applications. · github.com, 30 Sept 2026
- License
- Tracy is licensed under the 3-clause BSD license. · github.com, 30 Sept 2026
- Local privacy
- The 0.13 release notes say the assistant runs locally on the user's system and that its activity stays private. · github.com, 30 Sept 2026
- Maintainer
- The license names Bartosz Taudul as the copyright holder for 2017–2026. · github.com, 29 Sept 2026
- Merge limitation
- The release notes say trace merging preserves zones, messages and plots, while GPU zones, memory events and call stacks are lost. · github.com, 29 Sept 2026
- Other captured data
- It can profile memory allocations, locks and context switches, and attribute screenshots to captured frames. · github.com, 29 Sept 2026
- Other telemetry
- It can profile memory allocations, locks and context switches, and attribute screenshots to captured frames. · github.com, 30 Sept 2026
- Purpose
- Tracy is a real-time, nanosecond-resolution remote telemetry, hybrid frame and sampling profiler for games and other applications. · github.com, 30 Sept 2026
- Remote capture
- The project describes Tracy as a remote telemetry profiler. · github.com, 30 Sept 2026
- Sampling
- The 0.14 release notes describe heuristic reconstruction of zone call stacks when sampling is enabled. · github.com, 30 Sept 2026
- Security
- The 0.14.1 release notes say string-length encoding in the protocol was hardened. · github.com, 29 Sept 2026
- Third-party bindings
- The project points to third-party bindings for Rust, Zig, C#, OCaml and Odin, among other languages. · github.com, 29 Sept 2026
- Trace automation
- The 0.14 release added a capture daemon that discovers Tracy clients over UDP and captures each to a separate file, plus a tool to merge multi-process traces. · github.com, 29 Sept 2026
- Trace merging
- The 0.14 release added a tool to combine multi-process traces; the release notes say the implementation preserves zones, messages and plots, while GPU zones, memory events and call stacks are lost. · github.com, 30 Sept 2026
Where Tracy Profiler stands on Freedom251
- Game Profiling Software#16 of 25