Freedom251 › Container Monitoring

Sensu Go
What Sensu Go is
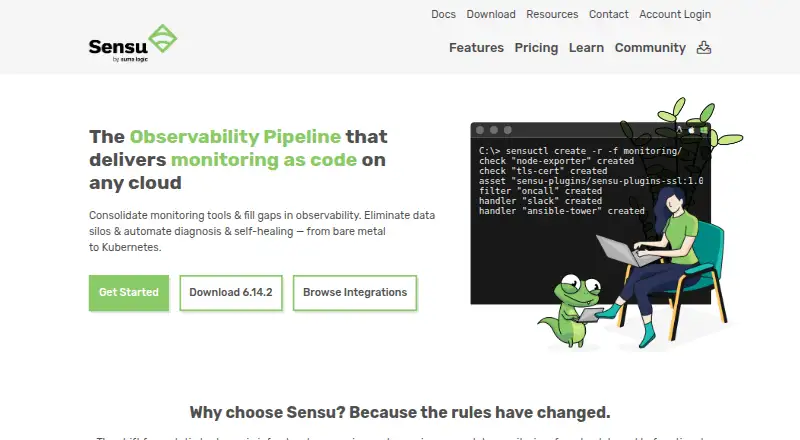
Sensu Go is a self-hosted monitoring and observability product for enterprises, built to help DevOps and SRE teams manage infrastructure ranging from Kubernetes to bare metal. It gathers monitoring events, filters and transforms them, then forwards them to a database the customer selects. Teams can define monitoring settings declaratively, track system and service health, collect basic and custom application metrics, and gather logs. Agents find and register virtual machines, cloud compute instances, containers, and services. Alerts can go to email, Slack, or SMS; Sensu can also create or resolve incidents in PagerDuty, ServiceNow, and JIRA, and deduplicate alerts. Remediation options include restarting services, running scripts, or requesting Ansible jobs. Sensu lists LDAP, Active Directory, OIDC SSO, mTLS authentication, external PKI verification, and CRL support. It is free for up to 100 nodes. Paid plans start at $3 per node per month, billed annually, and a 14-day trial is offered for evaluation beyond 100 nodes.
Who it suits
Sensu Go suits DevOps and SRE teams that need to monitor infrastructure across systems such as Kubernetes, cloud instances, containers, and bare metal. Its self-hosted deployment and declarative configuration may fit teams that manage monitoring as code.
What it does well
- Free plan covers up to 100 nodes.
- Agents discover VMs, cloud instances, and containers.
- Alerts support email, Slack, and SMS.
- Includes remediation actions such as service restarts.
- Offers LDAP, Active Directory, and OIDC SSO.
What to know first
- Free plan is limited to 100 nodes.
- Pro requires a 100-node minimum.
- Backend is unsupported on Windows and macOS.
- Paid pricing is billed annually per node.
Limits
The free plan covers up to 100 nodes. Pro costs $36 per node per year, billed annually, and has a 100-node minimum and lists 3,000 nodes; Enterprise has a 300-node minimum. A free 14-day trial is offered for evaluating Sensu beyond 100 nodes.
Plans
| Plan | Billed and limits | Price |
|---|---|---|
| Sensu Go FREE | no trial required · 100 nodes · 1 site | Free |
| Sensu Go Pro | $36.00 per node per year (= $3.00 per node/month, billed annually) · 100-node minimum · 3,000 nodes · 1 site · 6-hours support response | $36 a year |
| Sensu Go Enterprise | $60.00 per node per year (= $5.00 per node/month, billed annually) · 300-node minimum · unlimited nodes up to amount purchased · unlimited sites · 3-hours support response | $60 a year |
As sensu.io lists them, read 3 Oct 2026. The maker's own page has the final word.
Getting started
- Open https://sensu.io/ to review Sensu Go.
- Choose a deployment environment; Sensu lists AWS, GCP, Azure, Kubernetes, Red Hat OpenShift, Docker, and OpenStack.
- Download the package for your platform; Windows offers agent and CLI packages, macOS offers CLI and agent packages, and Linux offers backend, CLI, and agent packages.
- Start with the free plan for up to 100 nodes.
- Use the free 14-day trial to evaluate Sensu beyond 100 nodes.
- Choose Pro or Enterprise if a paid plan fits your node needs.
Sensu Go is a self-hosted monitoring and observability product for DevOps and SRE teams managing infrastructure from containers to bare metal. It suits organizations that want to automate monitoring and response across a varied estate. The 100-node free tier is a meaningful entry point, but paid node minimums can make expansion costly for smaller deployments.
Overview
Sensu collects monitoring events, filters and transforms them, then sends them to a database the customer chooses. That flexibility lets teams fit monitoring into an existing data setup, but also leaves them responsible for operating the self-hosted system and its destination.
Monitoring configuration is declarative and can be edited, reviewed, versioned, and shared. That is a useful foundation for teams that manage infrastructure changes through code. Agents discover and register virtual machines, public-cloud compute instances, containers, and services, reducing the work of keeping monitoring aligned with changing infrastructure.
Sensu says one cluster can monitor tens of thousands of nodes, with federation providing visibility across globally distributed infrastructure. That headroom favors large estates; it is less persuasive for a small deployment that does not need that scale.
Key features
Checks, telemetry, and event handling
Sensu supports system and service health checks, basic system metrics, custom application metrics, log collection, and custom scripts, including Nagios-style plugins. The range can consolidate several monitoring inputs, while the event pipeline gives teams control over filtering and transformation before data reaches their chosen database.
Alerting and remediation
Alerts can go by email, Slack, or SMS. Sensu can also create or resolve incidents in PagerDuty, ServiceNow, and JIRA, and deduplicate alerts to reduce repeated notifications. Remediation actions include restarting services, running custom scripts, and requesting Ansible jobs through Ansible Tower. This combination is most useful to teams prepared to define and maintain automated responses, rather than those seeking monitoring without operational setup.
Security and integrations
Security options include LDAP, Active Directory, and OIDC single sign-on, mTLS certificate authentication, external PKI verification, and certificate revocation list support. Named integrations and compatible tools include Elasticsearch, Splunk, PagerDuty, ServiceNow, Ansible Tower, Prometheus, and Nagios, giving teams familiar connection points across monitoring and incident workflows.
Pricing
Sensu Go FREE costs nothing and covers 100 nodes at one site, with no trial required. It is a sensible fit for a small estate or an initial deployment, but the one-site cap limits its use for organizations that need multi-site visibility.
Sensu Go Pro costs $36 a year, billed at $36.00 per node per year (= $3.00 per node/month, billed annually). It has a 100-node minimum, covers up to 3,000 nodes at one site, and includes a 6-hour support response. The minimum is a significant commitment for teams that outgrow the free tier by only a few nodes; the plan makes more sense when the deployment can use its capacity.
Sensu Go Enterprise costs $60 a year, billed at $60.00 per node per year (= $5.00 per node/month, billed annually). It requires at least 300 nodes, allows unlimited sites, and covers unlimited nodes up to the amount purchased, with a 3-hour support response. The higher rate and minimum are harder to justify for a single modest deployment, but the multi-site allowance and faster response target fit larger distributed operations.
A free 14-day trial is available for evaluating Sensu beyond 100 nodes. The annual billing terms and node minimums are central to the decision: this is not a low-commitment paid step-up for a small installation.
Platforms
Sensu is self-hosted and runs on AWS, GCP, Azure, Kubernetes, Red Hat OpenShift, Docker, and OpenStack. Windows and macOS packages are available for agents and CLI tools; Linux packages cover the backend as well as agents and CLI. The backend is unsupported on Windows and macOS, so those systems cannot host the backend. Listed platforms also include API, Linux, macOS, web, Windows, and self-hosted.
VM and service monitoring are supported, and agentless monitoring is also offered. This mix gives teams options across infrastructure types without changing the product's self-hosted operating model.
Who it's for
Sensu Go is best for DevOps and SRE teams that need discovery, event processing, alerting, and remediation across cloud, container, and bare-metal environments. It is particularly suited to organizations that want monitoring configuration under version control and need to route data to their own database. Small teams with fewer than 100 nodes can start free; teams needing paid capacity should weigh the minimums carefully.
It is a weaker fit for buyers who want a hosted service or a simple monitoring setup, and for small deployments that would pay for unused node capacity or sites.
Pros and cons
- Pros: Discovery across VMs, cloud compute, containers, and services helps monitoring keep pace with changing infrastructure.
- Pros: Checks, event processing, alerts, and remediation support a connected monitoring-to-response workflow.
- Pros: The free plan supports up to 100 nodes, enough to evaluate the product on a substantial small deployment.
- Cons: Paid plans require at least 100 nodes for Pro and 300 for Enterprise, which can force smaller teams to pay for more capacity than they need.
- Cons: The backend is unsupported on Windows and macOS, narrowing where those teams can host it.
- Cons: Self-hosting and a customer-chosen database give teams control but also leave more operational responsibility with them.
Alternatives
For a broader comparison, see Infrastructure Monitoring and Container Monitoring.
- Netdata is worth considering if its free tier's five active connected nodes and one active custom dashboard per room suit a smaller start.
- Checkmk may suit teams looking for a free community plan with 2,000+ pre-built integrations and support for up to about 100 hosts.
- openITCOCKPIT is another freemium infrastructure and application monitoring option with a free Community Edition.
- Checkmate is a free, self-hosted option with no monitor limits and 12 alert channels.
- Icinga offers a free and open-source edition with unlimited hosts and services.
- Mackerel has a free plan for five standard and micro hosts combined, with 500 metrics and one day of data retention.
- MetricsHub is an open-source project built around OpenTelemetry.
- Prometheus is a free, Apache 2.0-licensed open-source monitoring and alerting toolkit.
Verdict
Choose Sensu Go if your DevOps or SRE team needs a self-hosted monitoring pipeline that connects discovery and checks to alerting and automated remediation, especially across a large or distributed estate. Its free allowance is generous enough to make a real start. Look elsewhere if you need hosted simplicity or a small paid deployment: the annual per-node plans and minimum node counts are the clearest drawbacks.
Verdict
Sensu Go combines event processing, infrastructure discovery, alerting, and remediation in a self-hosted monitoring product. The free tier covers up to 100 nodes; paid plans start at $3 per node per month with annual billing.
Questions
Does Sensu Go have a free plan?
Yes. Sensu Go FREE costs nothing and covers 100 nodes.
What is the starting paid price?
Pro is $36 per node per year, billed annually, equivalent to $3.00 per node/month when billed annually. It has a 100-node minimum.
Is there a free trial?
Yes. Sensu offers a free 14-day trial for evaluating Sensu beyond 100 nodes.
Which platforms have packages?
Downloads include Windows agent and CLI packages, macOS CLI and agent packages, and Linux backend, CLI, and agent packages. The backend is unsupported on Windows and macOS.
Is Sensu Go self-hosted?
Yes. Sensu Go is self-hosted.
What integrations and compatible tools does Sensu name?
Sensu names Elasticsearch, Splunk, PagerDuty, ServiceNow, Ansible Tower, Prometheus, and Nagios among its integrations and compatible tools.
Facts from Sensu Go's own pages
- Alerting
- Sensu can send alerts through email, Slack, and SMS, create or resolve incidents in PagerDuty, ServiceNow, and JIRA, and deduplicate alerts. · sensu.io, 3 Oct 2026
- Cloud platforms
- Sensu says it runs on AWS, GCP, Azure, Kubernetes, Red Hat OpenShift, Docker, and OpenStack. · sensu.io, 3 Oct 2026
- Company history
- Sensu Go OSS was released in 2017 by Sensu Inc., which was acquired by Sumo Logic in June 2021. · sensu.io, 3 Oct 2026
- Discovery
- Sensu agents automatically discover and register VMs, public cloud compute instances, containers, and their services. · sensu.io, 3 Oct 2026
- Download platforms
- The download page offers Windows agent and CLI packages, macOS CLI and agent packages, and Linux backend, CLI, and agent packages; it states that the backend is unsupported on Windows and macOS. · sensu.io, 3 Oct 2026
- Founded
- 2017 · sensu.io, 28 Sept 2026
- Health and telemetry
- Sensu supports system and service health checks, custom scripts including Nagios-style plugins, basic system metrics, custom application metrics, and log collection. · sensu.io, 3 Oct 2026
- Integrations
- Sensu names Elasticsearch, Splunk, PagerDuty, ServiceNow, Ansible Tower, Prometheus, and Nagios among its integrations and compatible tools. · sensu.io, 3 Oct 2026
- Monitoring as code
- Sensu supports declarative monitoring configuration that teams can edit, review, version, and share. · sensu.io, 3 Oct 2026
- Observability pipeline
- Sensu collects, filters, and transforms monitoring events and sends them to a database of the customer's choosing. · sensu.io, 3 Oct 2026
- Pricing limit
- Sensu Go is free up to 100 nodes, and the pricing page describes a free 14-day trial for evaluating Sensu beyond 100 nodes. · sensu.io, 3 Oct 2026
- Purpose
- Sensu Go is a commercial monitoring and observability solution for enterprises, designed to help DevOps and SRE teams automate monitoring workflows and see infrastructure from Kubernetes to bare metal. · sensu.io, 3 Oct 2026
- Remediation
- Sensu supports self-healing actions such as restarting services, running custom scripts, and requesting Ansible jobs through Ansible Tower. · sensu.io, 3 Oct 2026
- Scale
- Sensu says a single cluster can monitor tens of thousands of nodes and federation provides visibility across globally distributed infrastructure. · sensu.io, 3 Oct 2026
- Security
- Sensu lists LDAP, Active Directory, and OIDC SSO, mTLS certificate authentication, external PKI verification, and CRL support. · sensu.io, 3 Oct 2026
Where Sensu Go stands on Freedom251
- Container Monitoring#26 of 49
- Infrastructure Monitoring#19 of 34
- Server Monitoring#22 of 38