Freedom251 › DNS Monitoring Software

Checkmate
by Checkmate
What Checkmate is
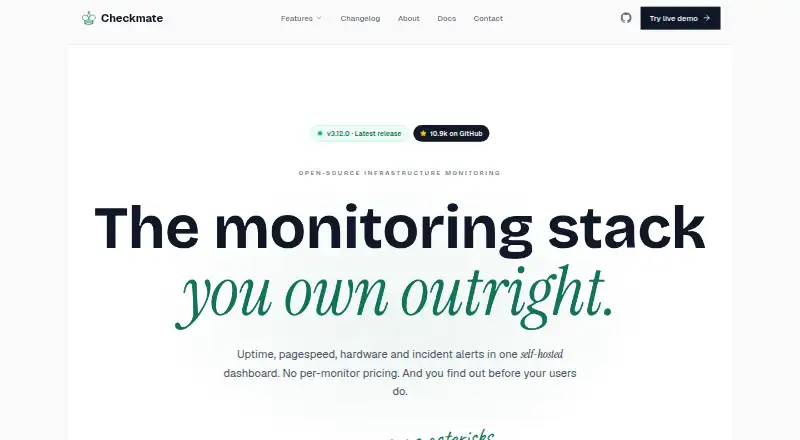
Checkmate is a free, open-source, self-hosted dashboard for monitoring infrastructure, service uptime, PageSpeed, and incident alerts. It checks HTTP, ping, TCP, gRPC, WebSocket, DNS, SSL, and more than 100 game server types. Its Capture agent reports server CPU, memory, disk, temperature, and network metrics. PageSpeed monitoring follows Lighthouse scores and Core Web Vitals over time, while public status dashboards can display service uptime, incident history, and custom branding. Alerts can be sent through email, Slack, Discord, Telegram, Twilio SMS, Pushover, ntfy, Matrix, Rocket.Chat, PagerDuty, Microsoft Teams, and webhooks. The operator's configured database stores metrics, logs, incidents, and user accounts; the maker says there is no phone-home or telemetry pipeline. Checkmate uses the AGPL-3.0 license and supports Docker Compose and Kubernetes/Helm deployment. Its image runs on x86, Apple Silicon, and Raspberry Pi. The free plan includes all features, no monitor limits, self-hosting, and 12 alert channels. The maker says there is no one-click migration import and no paid support tier.
Who it suits
It suits homelab operators, SaaS founders, agencies, sysadmins and DevOps, e-commerce teams, and open-source maintainers who can self-host monitoring. The listed deployment options include Docker Compose and Kubernetes/Helm.
What it does well
- No monitor limits on the free plan
- Checks many service and game server types
- Tracks server hardware metrics
- Public status dashboards support custom branding
- Metrics and accounts stay in the configured database
What to know first
- Self-hosting is required
- No one-click migration import
- No paid support tier
- Free plan lists 12 alert channels
Plans
| Plan | Billed and limits | Price |
|---|---|---|
| Free | All features · no monitor limits · self-hosted · 12 alert channels | Free |
As checkmate.so lists them, read 3 Oct 2026. The maker's own page has the final word.
Getting started
- Open the Checkmate website.
- Choose Docker Compose or Kubernetes/Helm deployment.
- Run the image on x86, Apple Silicon, or Raspberry Pi hardware.
- Configure the database where Checkmate will store its data.
- Use the API's JSON support to set up monitors in bulk, if needed.
- Select alert channels from the 12 included with the free plan.
Checkmate is an open-source monitoring dashboard for operators who want service checks, infrastructure metrics and PageSpeed tracking in one self-hosted system. It is a strong fit when control and broad monitoring matter more than managed operations; teams that want a hosted service should look elsewhere.
Overview
Checkmate brings uptime checks, server health, web performance and incident communication together. Checks cover HTTP, ping, TCP, gRPC, WebSocket, DNS, SSL and more than 100 game server types, giving operators room to monitor varied services rather than just websites. The breadth is useful, but it also means deployment and ongoing operation sit with the user.
Its Capture agent reports CPU, memory, disk, temperature and network metrics from servers. PageSpeed tracking follows Lighthouse scores and Core Web Vitals over time, while public status pages can show service uptime and incident history with custom branding. Together these make Checkmate relevant to teams that want a common view of service availability, infrastructure and web performance.
The maker says metrics, logs, incidents and user accounts remain in the database configured by the operator, with no phone-home or telemetry pipeline. Checkmate is AGPL-3.0 licensed, and its source can be read, forked and audited. That is meaningful control for privacy-conscious operators and open-source maintainers, but not a substitute for managed hosting.
Key features
- Service monitoring: Support for several protocols, SSL and game servers makes the checks useful across mixed services. Agentless monitoring is supported, though the facts do not define which checks require an agent.
- Infrastructure metrics: Capture reports core server measurements, including temperature. This suits sysadmins and DevOps teams who want host health alongside uptime, rather than a service-only view.
- PageSpeed history: Lighthouse scores and Core Web Vitals are tracked over time, giving web teams a way to follow performance changes as well as availability.
- Status pages and alerts: Public dashboards can present per-service uptime and incident history with custom branding. Alerts can reach email, Slack, Discord, Telegram, Twilio SMS, Pushover, ntfy, Matrix, Rocket.Chat, PagerDuty, Microsoft Teams and webhooks.
- Deployment and API: Docker Compose installation is documented, with Kubernetes/Helm deployment also listed. The image runs on x86, Apple Silicon and Raspberry Pi. A JSON-accepting API supports bulk monitor setup and has a REST reference; these options help operators automate setup, but do not remove deployment work.
Pricing
Free — free. The plan includes all features, no monitor limits, self-hosting and 12 alert channels. VM and service monitoring are included. There is no free trial because the product is free, and no separate paid tier is given. The lack of monitor caps makes it practical for expanding deployments, but the price is exchanged for operator effort rather than managed cloud service.
There is no paid support tier. The maker points users to Discord for the fastest help and GitHub issues for bugs and feature requests, so organizations needing contracted support should factor that into their choice.
Platforms
Checkmate is available for API, Linux, macOS, self-hosted, web and Windows environments. The documented deployment paths include Docker Compose and Kubernetes/Helm, and the image supports x86, Apple Silicon and Raspberry Pi. This range accommodates varied operator environments, though users remain responsible for running the system.
Who it's for
Checkmate suits homelab operators, SaaS founders, agencies, sysadmins and DevOps teams, e-commerce operators, and open-source maintainers who want broad monitoring without per-monitor limits. Its data-control model also appeals to teams that prefer metrics and incident records to stay in their own configured database. It is a poor fit for buyers who want managed cloud monitoring or an imported migration: there is no one-click migration import.
Pros and cons
- Pro: The free plan includes every feature with no monitor limits, so monitoring scale does not trigger a listed plan cap.
- Pro: Checks, server metrics, PageSpeed tracking, status pages and 12 alert channels cover several operational needs in one system.
- Pro: Operator-configured storage and the absence of a phone-home or telemetry pipeline provide direct control over monitoring data.
- Con: Self-hosting means users handle deployment and upkeep instead of relying on managed cloud.
- Con: There is no one-click migration import, which makes switching more manual.
- Con: Support is community-oriented, with no paid support tier for teams that need a contracted option.
Alternatives
- Dotcom-Monitor is a web, Windows, Linux, iOS and Android option with a free plan capped at 25 targets, five-minute minimum frequency, two locations and email alerts. Choose it if those stated limits suit you and you prefer its listed platform range.
- HetrixTools offers a free-for-life plan with 15 uptime monitors, 15 server monitors, one-minute checks and four locations. It is a better match when those caps and locations meet your needs.
- openstatus has a free Hobby plan limited to one monitor, one status page, three components and ten-minute minimum checks, plus a listed $30.00 U plan. Consider it when its plan structure is a closer fit.
- Better Uptime offers a free personal-project plan with 10 monitors and heartbeats, one status page, and Slack and email alerts. Choose it when those limits and its web, iOS and Android platforms suit the project.
- SolidPing lists a free-forever plan with five team members, 10 check executions per minute, 100 monitors and one private-location agent. It may fit teams that need those specific caps and a private-location agent.
- Spectate has a Hobby plan with five monitors or servers and one status page, while its Solo plan is $12 a month, billed $144 billed yearly. Consider it if that smaller plan scale fits your project.
- Statping-ng is another free, open-source, self-hosted option for readers comparing self-managed monitoring tools.
- StatusBot is another alternative to consider.
For category browsing, see Uptime Monitoring Software, Infrastructure Monitoring, DNS Monitoring Software and Container Monitoring.
Verdict
Choose Checkmate if you want a free, unrestricted monitoring dashboard, broad check coverage and control over where monitoring data lives—and are prepared to deploy and maintain it yourself. Its combination of service, server and PageSpeed monitoring is the main reason to choose it; the absence of managed cloud and one-click migration is the clearest reason to look elsewhere.
Verdict
Checkmate brings service checks, server metrics, PageSpeed tracking, and incident alerts into a self-hosted dashboard. It includes all features without monitor limits, but users give up managed cloud and must handle deployment themselves.
Questions
How much does Checkmate cost?
Its Free plan costs nothing. The plan includes all features, no monitor limits, self-hosting, and 12 alert channels.
Is Checkmate open source?
Yes. It is licensed under AGPL-3.0, and the maker says users can read, fork, and audit its source.
Which platforms can run Checkmate?
The listed platforms are API, Linux, macOS, self-hosted, web, and Windows. The maker says its image runs on x86, Apple Silicon, and Raspberry Pi.
What can Checkmate monitor?
It checks HTTP, ping, TCP, gRPC, WebSocket, DNS, SSL, and more than 100 game server types. Its Capture agent reports server metrics, and PageSpeed monitoring tracks Lighthouse scores and Core Web Vitals.
Where can it send alerts?
Alert channels include email, Slack, Discord, Telegram, Twilio SMS, Pushover, ntfy, Matrix, Rocket.Chat, PagerDuty, Microsoft Teams, and webhooks.
What support does Checkmate offer?
The maker identifies Discord as the fastest help channel and GitHub issues for bugs and feature requests. It says there is no paid support tier.
Facts from Checkmate's own pages
- API
- The maker says the API accepts JSON for bulk monitor setup and provides a REST API reference. · checkmate.so, 3 Oct 2026
- Audience
- The maker names homelabs, SaaS founders, agencies, sysadmins and DevOps, e-commerce, and open-source maintainers as users. · checkmate.so, 3 Oct 2026
- Availability checks
- It monitors HTTP, ping, TCP, gRPC, WebSocket, DNS, SSL, and more than 100 game server types. · checkmate.so, 3 Oct 2026
- Deployment
- The documentation describes Docker Compose installation and lists Kubernetes/Helm deployment; it says the image runs on x86, Apple Silicon, and Raspberry Pi. · checkmate.so, 3 Oct 2026
- Founded
- 2023 · checkmate.so, 28 Sept 2026
- Free plan
- Yes · checkmate.so, 23 Sept 2026
- Infrastructure
- The Capture agent reports CPU, memory, disk, temperature, and network metrics from servers. · checkmate.so, 3 Oct 2026
- Integrations
- Alert channels include email, Slack, Discord, Telegram, Twilio SMS, Pushover, ntfy, Matrix, Rocket.Chat, PagerDuty, Microsoft Teams, and webhooks. · checkmate.so, 3 Oct 2026
- License
- Checkmate is licensed under AGPL-3.0, and the maker says users can read, fork, and audit its source. · checkmate.so, 3 Oct 2026
- Limits
- The maker says there is no one-click migration import and describes managed cloud as something users give up when choosing Checkmate. · checkmate.so, 3 Oct 2026
- Maker
- Checkmate is built by Bluewave Labs with community contributors. · checkmate.so, 3 Oct 2026
- PageSpeed
- PageSpeed monitoring tracks Lighthouse scores and Core Web Vitals over time. · checkmate.so, 3 Oct 2026
- Product
- Checkmate is an open-source, self-hosted infrastructure monitoring dashboard for uptime, PageSpeed, hardware, Docker, and incident alerts. · checkmate.so, 3 Oct 2026
- Security and data
- The maker says metrics, logs, incidents, and user accounts stay in the database configured by the operator, with no phone-home or telemetry pipeline. · checkmate.so, 3 Oct 2026
- Status pages
- It provides public status dashboards with per-service uptime, incident history, and custom branding. · checkmate.so, 3 Oct 2026
- Support
- The maker identifies Discord as the fastest help channel and GitHub issues for bugs and feature requests, and says there is no paid support tier. · checkmate.so, 3 Oct 2026
Where Checkmate stands on Freedom251
- DNS Monitoring Software#1 of 37
- Uptime monitoring services#2 of 48
- Uptime Monitoring Software#2 of 48
- Container Monitoring#7 of 49
- Infrastructure Monitoring#5 of 34