Freedom251 › Infrastructure Monitoring

openITCOCKPIT
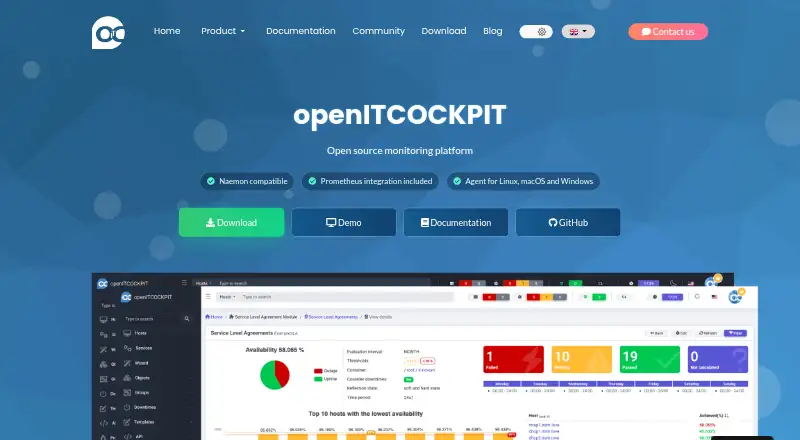
What openITCOCKPIT is
openITCOCKPIT is an open-source platform for monitoring servers, virtual machines, network devices, applications, containers, cloud environments, and IoT. Its web frontend and JSON API configure and visualize monitoring for Nagios, Naemon, and Prometheus, with user permissions; Naemon serves as its monitoring engine, and the platform is described as compatible with Nagios. Prometheus integration includes exporter management, alert rules, and graphical configuration. A cross-platform agent monitors resources and services on Windows, Linux, and macOS, including QEMU and Docker containers. Users can create and share dashboards and generate availability and SLA reports in PDF, HTML, or CSV, manually or on a schedule. Listed integrations include Grafana, PagerDuty, Slack, ServiceNow, and Nagios Core. The free Community Edition is available, alongside subscriptions priced at €1 a year for Bronze, €3.50 a year for Silver, €5 a year for Gold, and €10 a year for Platin. Ubuntu and Debian server support is listed for Community and Enterprise; Red Hat/Enterprise Linux server support is an Enterprise feature.
Who it suits
It suits teams monitoring mixed infrastructure and applications that need dashboards, reports, and integrations. The Community Edition may fit deployments using Ubuntu or Debian servers; Red Hat/Enterprise Linux server support is listed as an Enterprise feature.
What it does well
- Monitors infrastructure, applications, containers, cloud, and IoT.
- Provides web configuration and a JSON API.
- Generates scheduled availability and SLA reports.
- Community Edition is free.
What to know first
- Red Hat/Enterprise Linux server support requires Enterprise.
- Enterprise subscriptions limit production master systems to one.
- Basic subscription support includes up to five requests per contract period.
Limits
The free Community Edition is listed as free, with no service quota stated in the facts. Paid tiers list 1,000 services for Bronze, 5,000 services and 2 satellites for Silver, 10,000 services and 5 satellites for Gold, and 30,000 services and 10 satellites for Platin. Red Hat/Enterprise Linux server support is listed for Enterprise subscriptions.
Plans
| Plan | Billed and limits | Price |
|---|---|---|
| Community Edition | Fully free infrastructure and application monitoring | Free |
| Bronze | Price per year · 1,000 services | €1 a year |
| Platin | Price per year · 30,000 services · 10 satellites | €10 a year |
| Silver | Price per year · 5,000 services · 2 satellites | €3.50 a year |
| Gold | Price per year · 10,000 services · 5 satellites | €5 a year |
| Specific | Custom service and satellite needs; specific offer by contact | On request |
As openitcockpit.io lists them, read 30 Sept 2026. The maker's own page has the final word.
Getting started
- Visit https://openitcockpit.io/.
- Choose the free Community Edition or a paid subscription.
- Select a deployment on a supported platform; the product lists self-hosted and web platforms.
- Configure monitoring through the web frontend or JSON API.
- Add monitoring for infrastructure and applications, then build dashboards or reports.
openITCOCKPIT is a self-hosted monitoring platform for teams responsible for mixed infrastructure and applications. It suits organizations that want to bring Nagios-compatible checks and Prometheus metrics into one system. Its breadth is the draw; server-platform support and service limits should guide the edition choice.
Overview
A web frontend and JSON API handle configuration and visualization for Nagios, Naemon and Prometheus, with user permissions. Naemon is the monitoring engine and is described as 100% compatible with Nagios, which makes openITCOCKPIT a plausible fit for teams already invested in that monitoring model. Prometheus integration adds exporter management, alert rules and graphical configuration.
The platform covers servers, virtual machines, network devices, applications, containers, cloud environments and IoT. That range is useful when a team needs a shared view across different kinds of infrastructure, but may be more system than a narrowly defined monitoring task requires.
Key features
The cross-platform agent monitors CPU, memory, disks, network interfaces, services, processes and temperature sensors, along with QEMU and Docker containers on Windows, Linux and macOS. Server auto-discovery, process monitoring and container monitoring broaden its usefulness across varied estates.
Users can build and share dashboards, then generate availability and SLA reports manually or on a schedule in PDF, HTML or CSV. Integrations include Grafana, Prometheus, PagerDuty, Mattermost, Rocket.Chat, ServiceNow, Slack, i-doit, Checkmk and Nagios Core, offering routes into existing observability and notification workflows.
The editions comparison includes LDAP/Active Directory, single sign-on, multi-tenancy and role-based access control. The product and agent use TLS/SSL by default; HTTPS and TLS client authentication are also listed. The maker provides an email address for vulnerability reports, and lists high-impact vulnerabilities affecting versions before 5.5.2 and 5.4.0, so version management matters.
Pricing
The Community Edition is free and provides free infrastructure and application monitoring. It is the sensible starting point for teams that can work within Community's server-platform coverage: Ubuntu and Debian are supported there.
Bronze costs €1 a year and includes 1,000 services. Silver is €3.50 a year for 5,000 services and two satellites; Gold is €5 a year for 10,000 services and five satellites; Platin is €10 a year for 30,000 services and 10 satellites. These tiers progressively raise capacity and satellite allowances, making them relevant as monitored estates grow. Red Hat/Enterprise Linux support is an Enterprise subscription feature, so teams requiring those server platforms need to account for a subscription rather than assuming Community will suffice.
Specific has custom pricing for tailored service and satellite needs, with an offer available by contacting the maker. Enterprise subscriptions allow one production master system; Silver level and above permit up to two additional development or test systems. Basic subscription support includes up to five requests per contract period, while higher tiers list 25 or 50 cases per year and response times. Check the service, system and support terms against operational requirements before choosing a tier.
Platforms
The platform list includes API, iOS, Linux, macOS, self-hosted, web and Windows. Supported operating systems include Windows, macOS, Debian, Ubuntu, Red Hat Linux, CentOS, SLES and openSUSE, but the Enterprise distinction for Red Hat/Enterprise Linux is important. The homepage lists an iOS app release dated July 1, 2026.
Who it's for
openITCOCKPIT is strongest for organizations that want configurable, self-hosted monitoring spanning infrastructure and applications, especially where Nagios compatibility, Prometheus metrics, access controls, dashboards and scheduled reports belong in the same workflow. It is a weaker match for teams that need a highly constrained service monitor or cannot accommodate the server-platform and subscription boundaries.
Pros and cons
- Pros: Broad coverage across servers, networks, applications, containers, cloud and IoT gives mixed estates one monitoring platform.
- Pros: Naemon's stated Nagios compatibility and Prometheus configuration support suit teams combining established checks with metrics monitoring.
- Pros: Shared dashboards, scheduled SLA reports, integrations and identity controls support operational collaboration and access management.
- Cons: Community server support is limited to Ubuntu and Debian; Red Hat/Enterprise Linux requires an Enterprise subscription.
- Cons: Enterprise subscriptions constrain production to one master system, while service and satellite allowances vary by tier.
- Cons: Basic support is capped at five requests per contract period, which may not suit teams needing frequent vendor assistance.
Alternatives
Infrastructure Monitoring is the category to browse if you want to compare tools beyond this platform.
Choose Netdata if its free plan's limit of five active connected nodes and one active custom dashboard per room fits a smaller deployment. Checkmk is worth considering for its free Community plan, which includes 2,000+ pre-built integrations, up to about 100 hosts and community support. Sensu Go offers a free tier capped at 100 nodes and one site. Checkmate is a free, self-hosted option with all features, no monitor limits and 12 alert channels. Icinga offers a free, open-source edition with unlimited hosts and services and no subscription requirement.
Mackerel may suit a small deployment if its free-plan caps—five standard and micro hosts total, 500 metrics, one day of retention, 10 monitoring rules and one custom dashboard—are adequate. MetricsHub is an alternative built around an open-source OpenTelemetry project. Prometheus is a free, open-source monitoring and alerting toolkit for teams seeking that toolkit rather than openITCOCKPIT's broader combined platform.
Verdict
Choose openITCOCKPIT if you need a self-hosted system that unites Nagios-compatible monitoring, Prometheus metrics, broad infrastructure coverage and reporting. Its central advantage is that range; look elsewhere if your required server platform, service scale or support expectations do not fit the subscription terms.
Verdict
openITCOCKPIT covers a broad range of infrastructure and application monitoring, with dashboards, reporting, and integrations. Check server-platform support and subscription limits against your deployment needs.
Questions
Is openITCOCKPIT free?
Yes. The Community Edition costs nothing and is described as fully free infrastructure and application monitoring.
What do the paid plans cost?
Bronze is €1 a year, Silver is €3.50 a year, Gold is €5 a year, and Platin is €10 a year. Specific needs are priced by offer through contact.
Which platforms does it support?
Listed platforms include API, iOS, Linux, macOS, self-hosted, web and Windows. The supported operating systems list also includes Debian, Ubuntu, Red Hat Linux, CentOS, SLES and openSUSE.
What integrations are listed?
They include Grafana, Prometheus, PagerDuty, Mattermost, Rocket.Chat, ServiceNow, Slack, i-doit, Checkmk and Nagios Core.
Does it support Nagios monitoring?
Yes. The web interface and API configure and visualize Nagios, Naemon and Prometheus monitoring. Naemon is the monitoring engine, and the platform is described as 100% compatible with Nagios.
Where is openITCOCKPIT based?
Its headquarters are in Fulda, Germany.
Facts from openITCOCKPIT's own pages
- Dashboards and reports
- Users can build and share dashboards, and generate availability and SLA reports manually or on a schedule in PDF, HTML and CSV formats. · openitcockpit.io, 30 Sept 2026
- Enterprise limits
- Enterprise subscriptions allow one production master system, and Silver level and above permit up to two additional development or test systems. · openitcockpit.io, 30 Sept 2026
- Headquarters
- Fulda, Germany · openitcockpit.io, 28 Sept 2026
- Identity and access
- The editions comparison lists LDAP/Active Directory, single sign-on, multi-tenancy and role-based access control. · openitcockpit.io, 30 Sept 2026
- Integrations
- Listed integrations include Grafana, Prometheus, PagerDuty, Mattermost, Rocket.Chat, ServiceNow, Slack, i-doit, Checkmk and Nagios Core. · openitcockpit.io, 30 Sept 2026
- Metrics monitoring
- Prometheus integration supports exporter management, alert rules and graphical configuration. · openitcockpit.io, 30 Sept 2026
- Mobile app
- The product homepage lists an openITCOCKPIT iOS app release dated July 1, 2026. · openitcockpit.io, 30 Sept 2026
- Monitoring agent
- Its cross-platform agent monitors CPU, memory, disks, network interfaces, services, processes, temperature sensors, QEMU and Docker containers on Windows, Linux and macOS. · openitcockpit.io, 30 Sept 2026
- Monitoring engine
- It uses Naemon as its monitoring engine and is described as 100% compatible with Nagios. · openitcockpit.io, 30 Sept 2026
- Purpose
- openITCOCKPIT is an open source monitoring platform for servers, virtual machines, network devices, applications, containers, cloud environments and IoT. · openitcockpit.io, 30 Sept 2026
- Security
- The product and its monitoring agent use TLS/SSL by default, with HTTPS and TLS client authentication listed on the product page. · openitcockpit.io, 30 Sept 2026
- Security disclosures
- The maker provides an email address for vulnerability reports and lists high-impact vulnerabilities affecting versions before 5.5.2 and 5.4.0. · openitcockpit.io, 30 Sept 2026
- Support
- Basic subscription support includes up to five support requests per contract period; higher support tiers list 25 or 50 cases per year and response times. · openitcockpit.io, 30 Sept 2026
- Supported server platforms
- The editions page lists Ubuntu/Debian support for Community and Enterprise, while Red Hat/Enterprise Linux is an Enterprise subscription feature. · openitcockpit.io, 30 Sept 2026
- Web interface and API
- It provides a configuration and visualization web frontend for Nagios, Naemon and Prometheus, with a JSON API and user permissions. · openitcockpit.io, 30 Sept 2026
Where openITCOCKPIT stands on Freedom251
- Infrastructure Monitoring#14 of 34
- Server Monitoring#16 of 38