Freedom251 › Infrastructure Monitoring

MetricsHub
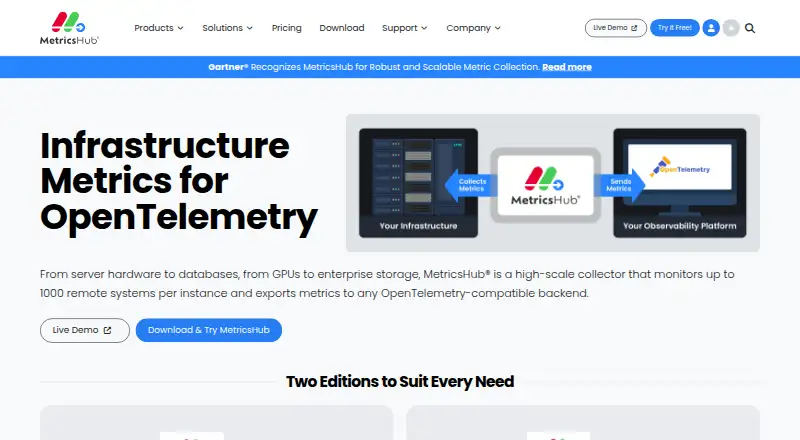
What MetricsHub is
MetricsHub is an open-source, OpenTelemetry-based collector for monitoring infrastructure and exporting metrics to observability platforms. One instance can remotely monitor up to 1,000 hosts, with connectors for servers, storage, network devices, databases, and enterprise applications. Connectors collect data through methods including HTTP, IPMI, JMX, SNMP, SSH, WBEM, WinRM, and WMI. Users can extend monitoring through declarative YAML configuration without custom code. MetricsHub can also monitor power consumption, carbon intensity, and electricity costs. Its web interface covers configuration, metric and resource visualization, analysis, and troubleshooting, and named integrations include BMC Helix, Datadog, Grafana, ServiceNow, New Relic, Prometheus, and Splunk. The self-hosted product supports Linux and Windows. Community Edition is free and includes basic hardware monitoring, 20+ dedicated connectors, and remote monitoring. Enterprise Edition costs $15 a month, billed per host, and includes a 30-day trial, 200+ connectors, an embedded OpenTelemetry Collector, and premium support. The site describes Community for smaller projects and Enterprise for mission-critical environments.
Who it suits
Community Edition is described for small-scale or individual projects; Enterprise is described for mission-critical environments. MetricsHub suits organizations seeking self-hosted infrastructure monitoring across Linux and Windows.
What it does well
- One instance can monitor up to 1,000 hosts remotely.
- Connectors cover servers, storage, networks, databases, and applications.
- YAML configuration extends monitoring without custom code.
- Monitors power use, carbon intensity, and electricity costs.
- Community Edition includes remote monitoring and 20+ connectors.
What to know first
- Enterprise is billed per host.
- Self-hosted deployment is required.
- Enterprise costs $15 a month.
Limits
The free Community Edition includes Linux and Windows monitoring, basic hardware monitoring, 20+ dedicated connectors and remote monitoring. Enterprise is listed at $15 a month billed per host, with 200+ connectors, an embedded OpenTelemetry Collector, premium support and a 30-day trial.
Plans
| Plan | Billed and limits | Price |
|---|---|---|
| Community Edition | Linux and Windows monitoring · basic Redfish/SNMP/WMI hardware monitoring · 20+ connectors · sustainability metrics · remote monitoring · executable-package installation | Free |
| Enterprise Edition | per host/month; 30-day trial period · Linux and Windows monitoring · basic Redfish/SNMP/WMI hardware monitoring · 200+ connectors · sustainability metrics · remote monitoring · executable-package installation · embedded secured OpenTelemetry Collector · MetricsHub and Prometheus premium support | $15 a month |
As metricshub.com lists them, read 15 Oct 2026. The maker's own page has the final word.
Getting started
- Visit https://www.metricshub.com/.
- Choose the free Community Edition or review the Enterprise Edition and its 30-day trial.
- Deploy MetricsHub in a self-hosted environment on Linux or Windows.
- Configure monitoring and connectors through the web interface or declarative YAML.
Verdict
MetricsHub brings broad infrastructure collection, a web interface, and named observability integrations to a self-hosted deployment. Community Edition provides a free entry point, while Enterprise adds more connectors and premium support at a per-host monthly price.
Questions
Is MetricsHub free?
Yes. The Community Edition is listed as free.
What does Enterprise cost?
Enterprise Edition is listed at $15 a month, billed per host, with a 30-day trial period.
Which platforms does it support?
MetricsHub is self-hosted and supports Linux and Windows monitoring. Its listed platforms also include API and web.
Is MetricsHub open source?
Yes. MetricsHub describes itself as an open-source project built around OpenTelemetry.
Which observability platforms are named as integrations?
The integrations page names BMC Helix, Datadog, Grafana, ServiceNow, New Relic, Prometheus and Splunk.
Who makes MetricsHub?
The site identifies MetricsHub S.A.S. as the maker and lists its headquarters in Paris, France.
Facts from MetricsHub's own pages
- API authentication
- MetricsHub exposes REST API access authenticated by API keys stored in an encrypted local PKCS#12 keystore. · metricshub.com, 15 Oct 2026
- API-key lifecycle
- The apikey CLI can create, list and revoke keys, with optional expiration dates. · metricshub.com, 15 Oct 2026
- Audience
- The Community Edition is described as suitable for small-scale or individual projects, while Enterprise is described for mission-critical environments. · metricshub.com, 7 Oct 2026
- Build requirements
- The Community repository requires Maven 3.x and the latest LTS Temurin JDK 25 for builds. · github.com, 15 Oct 2026
- Collection protocols
- The agent collects metrics through HTTP, IPMI, JMX, SNMP, SSH, WBEM, WinRM and WMI. · metricshub.com, 15 Oct 2026
- Community support
- Both editions include access to a community Slack channel; Enterprise additionally advertises 24x7 premium support. · metricshub.com, 15 Oct 2026
- Company origin
- MetricsHub says Bertrand Martin created it in 2023 as a Sentry Software initiative. · metricshub.com, 15 Oct 2026
- Company profile
- LinkedIn lists MetricsHub as privately held, founded in 2023, headquartered in Paris and employing 11–50 people. · linkedin.com, 15 Oct 2026
- Connector coverage
- The documentation describes more than 300 built-in connectors across servers, storage, network devices, databases and enterprise applications. · metricshub.com, 15 Oct 2026
- Coverage
- MetricsHub includes connectors for servers, storage systems, network devices, databases and enterprise applications. · metricshub.com, 7 Oct 2026
- Customization
- Users can extend monitoring through declarative YAML configuration without custom code. · metricshub.com, 7 Oct 2026
- Custom monitoring
- Declarative YAML connectors allow monitoring extensions without writing custom code. · metricshub.com, 15 Oct 2026
- Deployment platforms
- Official installation documentation supports Windows, Linux distributions including Debian, Ubuntu, RHEL and CentOS, and Docker. · metricshub.com, 15 Oct 2026
- Documentation depth
- The documentation includes installation, configuration, integrations, security, troubleshooting, protocol CLIs, connector directories and release notes. · metricshub.com, 15 Oct 2026
- Enterprise packaging
- Enterprise provides MSI, DEB, RPM and Docker installation packages, while Community uses manual archive setup. · metricshub.com, 15 Oct 2026
- Headquarters
- Paris, France · metricshub.com, 28 Sept 2026
- Independent pricing listing
- GetApp lists Community as free and Enterprise as 15 per month, with a free trial and free version. · getapp.com, 15 Oct 2026
- Integrations
- Documented integrations include Prometheus, Datadog, BMC Helix, Alertmanager, Grafana dashboards and MCP-based AI agents. · metricshub.com, 15 Oct 2026
- Latest release change
- Release 3.9.07 upgraded OpenTelemetry Collector Contrib to version 0.161.0 and added Enterprise license validation to the CLI. · metricshub.com, 15 Oct 2026
- License
- The public MetricsHub Community repository is licensed under GNU Affero General Public License version 3.0. · github.com, 15 Oct 2026
- Limit: resource discovery
- A Gartner reviewer praised the connectors but said the product lacked automatic resource discovery. · gartner.com, 15 Oct 2026
- M8B assistant
- The web interface includes an M8B virtual assistant for administrator analysis and troubleshooting, using an OpenAI API key configured locally. · metricshub.com, 15 Oct 2026
- Maker
- The site copyright identifies MetricsHub S.A.S. · metricshub.com, 7 Oct 2026
- Maker legal name
- The pricing page copyright identifies the company as MetricsHub S.A.S. · metricshub.com, 15 Oct 2026
Where MetricsHub stands on Freedom251
- Infrastructure Monitoring#2 of 34