Freedom251 › AI Infographic Makers

Datastory
What Datastory is
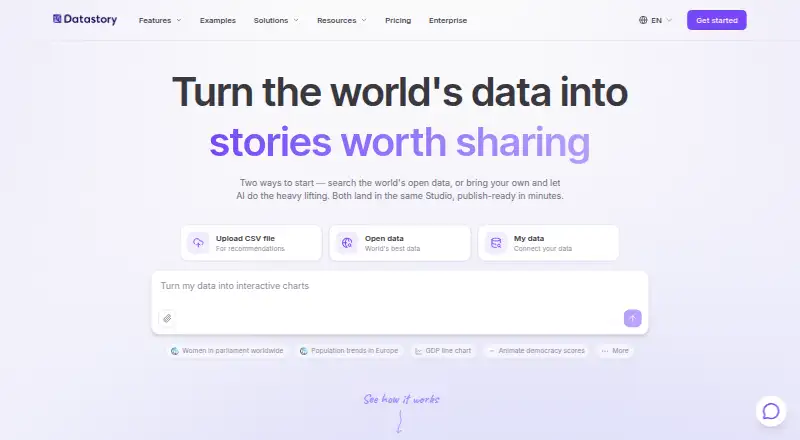
Datastory turns data into interactive charts, data-driven web applications, and presentations that can be published as stories. Its AI can interpret uploaded data, recommend visualizations, identify insights, and draft captions grounded in workspace data. The chart picker reads data columns and recommends encodings for categorical, temporal, geographic, or hierarchical information. Visualizations can be published through standalone links, embedded in websites, or exported as high-quality images. An Open Data catalog offers statistics from sources including OECD, WHO, Eurostat, the World Bank, and the UN. Datastory says visualizations can also be embedded in Notion, Webflow, newsletters, and content management systems. The free Starter plan includes 10 visualizations, up to three team members, 100 AI credits per month, and unlimited open data downloads. Professional costs $15 a month per user and includes unlimited visualizations and collaborators, 1,000 monthly AI credits, priority support, and custom branding. Datastory describes its audience as data storytellers, analysts, journalists, NGOs, and research teams. The company is based in Stockholm and was founded in 2005.
Who it suits
Datastory suits data storytellers, analysts, journalists, NGOs, and research teams who want to turn data into publishable visual content. The Starter plan covers small teams, while Professional allows unlimited collaborators and visualizations.
What it does well
- AI suggests visualizations from uploaded data
- Chart picker reads data columns
- Publish as links, embeds, or images
- Open Data catalog includes international sources
- Starter includes unlimited open data downloads
What to know first
- Starter allows 10 data visualizations
- Starter is limited to three team members
- Accessibility support is on the roadmap
Limits
Starter includes 10 data visualizations, up to three team members, and 100 AI credits per month. It includes unlimited open data downloads.
Plans
| Plan | Billed and limits | Price |
|---|---|---|
| Starter | 10 data visualizations · Up to 3 team members · 100 AI credits per month · Unlimited open data downloads | Free |
| Professional | per user · Unlimited data visualizations · Unlimited collaborators · 1000 AI credits per month · Priority support · Custom logo and theming | $15 a month |
| Enterprise | Custom · Unlimited visualizations and collaborators · Custom data integration and modeling · Custom visualizations · Dedicated account manager · AI credits on demand | On request |
As datastory.tech lists them, read 3 Oct 2026. The maker's own page has the final word.
Getting started
- Open the Datastory website in a web browser.
- Start with the free Starter plan.
- Import data into a workspace.
- Use the chart picker and AI tools to develop visualizations.
- Publish visualizations as links, embeds, or exported images.
Datastory turns data into interactive charts, web applications and presentations that can be published as stories. It suits analysts, journalists, NGOs and research teams that need to explain data visually and publish it in several formats. Its free tier is a useful starting point, but the 10-visualization and three-person caps make Professional the practical choice for ongoing team work.
Overview
Datastory combines chart-making with a publishing workflow: visualizations can stand alone as links, appear embedded in websites, or be exported as high-quality images. The Open Data catalog adds statistics from sources such as OECD, WHO, Eurostat, the World Bank and the UN, which can help users start from established public datasets rather than importing everything themselves.
Its AI can interpret uploaded data, recommend visualizations, surface insights and draft captions grounded in workspace data. The chart picker also reads data columns and recommends encodings for categorical, temporal, geographic and hierarchical information. That guidance is relevant for people working across varied data, though the product's central strength is explaining and publishing data, not simply producing static graphics.
Key features
Publishing flexibility is a practical advantage: the same visualization can be shared as a link, embedded in a site or exported as an image. Datastory says embedding works in Notion, Webflow, newsletters and content management systems, giving teams multiple routes to put work in front of readers.
For collaborative or governance-conscious teams, role-based access control and multi-factor authentication accompany encryption in transit with TLS 1.3 and at rest with AES-256. Datastory states that it complies with GDPR as a data processor and platform provider, with a data processing agreement standard in project contracts. Primary data centers are in EU/EEA regions; enterprise customers may request data-residency options. Linked data, for connecting datasets in a knowledge graph and reusing metric definitions, is an Enterprise feature.
Accessibility remains a gap to weigh: contrast-checked, color-blind-safe palettes are in progress, while keyboard and screen-reader support are on the roadmap. Teams for whom accessible visualizations are a present requirement should account for that status before choosing Datastory.
Pricing
Starter costs nothing. It includes 10 data visualizations, up to 3 team members, 100 AI credits per month, unlimited open-data downloads and email support. This is enough room to explore the workflow or support a small, occasional project, but the visualization and seat ceilings constrain sustained team publishing.
Professional costs $15 a month, billed per user. It removes the visualization and collaborator limits and raises the allowance to 1000 AI credits per month; priority support, custom logo and theming are also included. For teams publishing regularly, the per-user billing is the key trade-off: capacity expands, but costs scale with the people on the account.
Enterprise has custom pricing and includes unlimited visualizations and collaborators, custom data integration and modeling, custom visualizations, a dedicated account manager and AI credits on demand. It is the tier for organizations needing bespoke data work or linked-data capabilities, rather than a predictable self-serve price.
Platforms
Datastory is available on the web. The service supports data import, team collaboration and interactive publishing, and the plans include a 15-project limit.
Who it's for
Datastory is best suited to data storytellers, analysts, journalists, NGOs and research teams that need to turn datasets into explorable, shareable explanations. The open-data catalog and chart recommendations make it especially relevant when projects span different data types; its publishing options suit work intended for websites and other channels. It is less compelling for users whose primary need is accessible chart output today, given that keyboard and screen-reader support remain on the roadmap.
Pros and cons
- Multiple publishing formats: links, embeds and high-quality image exports let teams adapt a visualization to different channels.
- Guidance for varied datasets: column-aware chart recommendations and AI-assisted insight and caption drafting can support the path from data to explanation.
- Useful free entry point: unlimited open-data downloads and 100 monthly AI credits are included, but 10 visualizations and three team members limit continued use.
- Accessibility work remains unfinished: contrast and color-blind-safe palettes are in progress, and keyboard and screen-reader support are still on the roadmap.
- Professional scales by seat: visualizations and collaborators are unlimited, but the $15 a month per-user price can add up as teams grow.
Alternatives
Choose Visme instead if you want a broader web and desktop/mobile platform; its free Basic plan includes 500MB of storage and 50 slides/pages per project. Infogram is another option for users focused on interactive charts and maps, with its Basic plan offering 35+ chart types, 13 map types and online publishing.
Jeda.ai is an alternative. Piktochart is worth considering for infographic work; its Free plan includes 2 downloads and 1 GB storage. InfografAI offers a free Starter plan with 3 credits and 10 infographic styles. Venngage is another option, with a free plan limited to 5 designs and 6 image uploads. Text to Infographic is an alternative. a.graphics is a free web-based alternative.
For broader comparisons, see AI Infographic Makers, Data Storytelling Tools and Infographic Software.
Verdict
Choose Datastory if your work depends on turning real datasets into interactive stories and publishing them across links, embeds and image exports. Its chart guidance, open-data catalog and generous Professional collaboration limits support that workflow. Look elsewhere if accessibility support is a must-have now, or if per-user Professional pricing does not suit a growing team.
Verdict
Datastory combines data-driven charts and stories with publishing options and AI assistance. Its free Starter tier has limits on visualizations and team size; Professional costs $15 a month per user.
Questions
Is Datastory free?
Yes. Starter costs nothing and includes 10 visualizations, up to three team members, 100 AI credits per month, and unlimited open data downloads.
What does Professional cost?
Professional costs $15 a month, billed per user. It includes unlimited visualizations and collaborators, 1,000 AI credits per month, priority support, and custom logo and theming.
What platforms does Datastory support?
Datastory is available on the web.
Can visualizations be embedded in other tools?
Yes. Datastory says visualizations can be embedded in Notion, Webflow, newsletters, and content management systems.
What is linked data?
Linked data is an Enterprise feature for connecting datasets in a knowledge graph and reusing consistent metric definitions.
Where is Datastory based?
Datastory is headquartered in Stockholm, Sweden, and was founded in 2005.
Facts from Datastory's own pages
- Accessibility
- The visualization page says contrast checked and color blind safe palettes are in progress, with keyboard and screen reader support on the roadmap. · datastory.tech, 3 Oct 2026
- AI workflow
- Its AI can interpret uploaded data, suggest visualizations, identify insights, and draft captions grounded in workspace data. · datastory.tech, 3 Oct 2026
- Audience
- Datastory describes its intended users as data storytellers, analysts, journalists, NGOs, and research teams. · datastory.tech, 3 Oct 2026
- Charts
- The chart picker reads data columns and recommends encodings for categorical, temporal, geographic, or hierarchical data. · datastory.tech, 3 Oct 2026
- Compliance
- Datastory states it complies with GDPR as a data processor and platform provider, and that a data processing agreement is standard in project contracts. · datastory.tech, 3 Oct 2026
- Data location
- The security page says primary data centers are in EU/EEA regions and enterprise customers may request data residency options. · datastory.tech, 3 Oct 2026
- Founded
- 2005 · datastory.tech, 28 Sept 2026
- Headquarters
- Stockholm, Sweden · datastory.tech, 28 Sept 2026
- Integrations
- Datastory says visualizations can be embedded in Notion, Webflow, newsletters, and content management systems. · datastory.tech, 3 Oct 2026
- Linked data
- Linked data is described as an Enterprise feature for connecting datasets in a knowledge graph and reusing consistent metric definitions. · datastory.tech, 3 Oct 2026
- Open data
- The Open Data catalog offers statistics from sources including OECD, WHO, Eurostat, World Bank, and the UN. · datastory.tech, 3 Oct 2026
- Product
- Datastory turns data into interactive charts, data driven web applications, and presentations that can be published as stories. · datastory.tech, 3 Oct 2026
- Publishing
- Visualizations can be published as standalone links, embedded in websites, or exported as high quality images. · datastory.tech, 3 Oct 2026
- Security
- The security page states that data is encrypted in transit with TLS 1.3 and at rest with AES-256, and that accounts use role based access control and multi factor authentication. · datastory.tech, 3 Oct 2026
- Support
- The Starter plan includes email support, Professional includes priority support, and Enterprise includes dedicated support. · datastory.tech, 3 Oct 2026
Where Datastory stands on Freedom251
- AI Infographic Makers#6 of 24
- Data Storytelling Tools#8 of 22
- Infographic Software#16 of 42