Running games in a database does not make the database treat those queries differently. The risk is that game-related queries or other demanding workloads share an instance with live application traffic and compete for finite CPU, memory, worker capacity, and storage I/O. That competition can increase query latency or reduce throughput; it does not automatically make the database unavailable.
What happens if a heavy query runs while users are using the database?
The database schedules work from multiple sessions against shared resources. A query that scans or sorts substantial data may consume CPU, memory, and storage bandwidth. If concurrent requests need those same resources, they can wait longer or complete more slowly. The outcome depends on the query plan, concurrency, available capacity, and which resource is already under pressure—not on whether the data or query is associated with a game.

As an Amazon Associate I earn from qualifying purchases.
Parallel execution can multiply resource demand. PostgreSQL documentation explains that each parallel worker is a separate process with an impact similar to an additional user session, and that settings such as work_mem apply per worker. PostgreSQL 18 gives this example: “For example, a parallel query using 4 workers may use up to 5 times as much CPU time, memory, I/O bandwidth, and so forth as a query which uses no workers at all.” This is a documented possible multiplier for that example, not a benchmark or a rule for every query. PostgreSQL 18: Resource Consumption
Recommended Free Tools
A slowdown in some requests is not the same as an outage. A workload becomes a production concern when resource demand or waits interfere with the latency and throughput the application needs.
Diagnose the bottleneck before changing limits
Start by identifying active queries and sessions, what they are waiting on, and whether the host is under pressure. A slow query may need a better plan; a limit aimed at the wrong resource can reduce useful throughput without addressing the cause.
For PostgreSQL
- Use PostgreSQL’s cumulative statistics and database activity facilities to examine what is running and where time is spent.
- Investigate a poorly performing query with
EXPLAINto inspect its plan. - Check host-level behavior alongside database activity. PostgreSQL’s monitoring documentation names
ps,top,iostat, andvmstatas useful system-monitoring tools. PostgreSQL 18: Monitoring Database Activity
For SQL Server
Inspect session classification, workload-group and resource-pool statistics, and request behavior. Microsoft’s configuration walkthrough demonstrates monitoring with system views and counters covering CPU use, request counts, blocked tasks, lock waits, memory grants, parallel threads, and I/O. Create and Validate Resource Governor Configuration
Rank #2

- HPE SMART CHOICE PROLIANT MODEL P83316-005: Factory-tested and preconfigured for reliability, this HPE ProLiant ML30 Gen11 Smart Choice model includes Intel Xeon 6333P (6 cores, 3.10 GHz), 32GB DDR5 ECC memory, 2 x 480GB SATA SSDs, dual 500W Flex Slot power supplies, Intel VROC SATA storage controller, and an embedded 1GbE 4-Port Ethernet adapter—ready for immediate deployment
- HIGH-PERFORMANCE FOR BUSINESS WORKLOADS: Designed for small offices, branch environments, and hybrid cloud, this tower server delivers enterprise-class performance for virtualization, file sharing, database hosting, ERP systems, and collaboration tools, ensuring smooth operations for growing businesses.
- SCALABLE STORAGE AND EXPANSION: Supports up to 8 SFF hot-plug drives and onboard M.2 NVMe SSD for fast boot options. With four PCIe slots including PCIe Gen5 x16, this server is ideal for data-intensive applications, backup solutions, and future expansion
- BUILT-IN SECURITY AND RELIABILITY: Protect your critical data with HPE iLO Silicon Root of Trust, TPM 2.0 encryption, and firmware malware detection and recovery. Dual redundant 500W power supplies ensure uptime for mission-critical workloads and secure file storage
- INTELLIGENT MANAGEMENT AND AUTOMATION: Integrated HPE iLO 6 enables remote monitoring, reporting, and automation for quick issue resolution. Compatible with HPE OneView and Compute Ops Management, making it perfect for businesses adopting hybrid cloud strategies and centralized IT management
Build a useful baseline
Compare like with like: record the application or login, query pattern, request concurrency, CPU and I/O waits, memory grants, and relevant workload-group counters. Measure across representative peak periods before and after a change. These comparisons help distinguish a query-plan problem from resource contention and show whether a policy is helping, but they do not guarantee a particular latency improvement.
Choose a protection that fits the database engine
The right control depends on the engine and service tier, the resource under pressure, the workload you want to isolate, and your ability to monitor and reverse a change. There is no universal safe cap in the vendor documentation for an unspecified system.
Rank #3
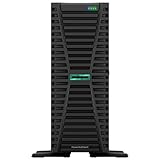
- HPE ProLiant G11, tailored for hybrid environments, delivers an intuitive operating experience, robust security, and optimized performance for diverse virtualized workloads. Whether for large enterprises or small businesses, it ensures seamless control and accelerates innovation across your data ecosystem.
- Dual (2) Xeon Silver 4410y 12-Core 2.00 GHz, 30MB Cache, Up To 3.90 GHz Turbo
- Memory: 256GB (8 x 32GB) DDR5-4800MHz PC5-38400 ECC Buffered Memory
- Storage: 15.36TB (4 x 3.84TB) Enterprise 2.5” SATA III 6Gbs SSDs for Ultra Fast Storage
- Hard drives and memory upgrades included separately not installed, installation required.
| Environment | Available approach in the cited documentation | Important boundary |
|---|---|---|
| SQL Server Database Engine | Resource Governor can classify sessions into workload groups and place groups in resource pools with policies for CPU, memory, and physical I/O. | Controls apply within an instance, not across instances; physical I/O controls do not govern system-task writes such as transaction-log, checkpoint, and lazy-writer I/O. [Microsoft Learn, Resource Governor – SQL Server] |
| Azure SQL Database | Resource governance is managed by the platform. | Users cannot configure Resource Governor pools and workload groups. [Microsoft Learn, Resource Governor – SQL Server] |
| PostgreSQL | Use activity and host monitoring, inspect query plans, and evaluate parallel-query and resource settings in the specific deployment. | The cited PostgreSQL documentation does not establish a general-purpose equivalent to SQL Server Resource Governor for isolating arbitrary application classes into resource pools. Per-worker settings do not amount to a universal per-query total-memory cap. [PostgreSQL 18 documentation] |
Protect SQL Server workloads with Resource Governor
Resource Governor separates the classification of incoming sessions from the policies applied to their work. A classifier can route sessions based on attributes such as login or program name. A workload group applies common policies to requests; a resource pool provides a container for resource controls. Microsoft describes uses including multitenant isolation, predictable service levels, and limiting runaway or I/O-intensive queries. Resource Governor – SQL Server
Workload-group policies include controls such as maximum degree of parallelism and maximum memory grant per query, alongside monitoring of group activity. These controls can shape a distinct workload, but choosing values still requires measurements for the target instance and traffic pattern. Resource Governor Workload Group – SQL Server
Rank #4

- HPE ProLiant DL380 Gen10 2U Rack Server with Rail kit for Enterprise
- Dual (2) Xeon Gold 6130 16-Core 2.10 GHz, 22MB, Up To 3.70 GHz Turbo
- Memory: 256GB (8 x 32GB) DDR4 PC4-25600 3200MHz Unbuffered Memory
- Storage: 7.68TB (4 x 1.92TB) Enterprise 2.5” SATA III 6Gb/s SSDs for Ultra Fast Storage
- Hard drives and memory upgrades included separately, not installed, installation required.
- Instance scope: Resource Governor manages Database Engine resources on an instance; it is not a cross-instance workload manager.
- Availability-group replicas: SQL Server configuration does not automatically propagate to other instances, so configure and verify each relevant instance consistently.
- Version-specific capability: Microsoft identifies total
tempdbspace limits by application or user workload as a SQL Server 2025 (17.x) preview feature. Verify version and support status before depending on it. - Service-tier distinction: Azure SQL Database uses resource governance internally but does not support user configuration of pools and workload groups. Do not assume the SQL Server configuration model applies there.
Protect PostgreSQL workloads without assuming a universal cap
The PostgreSQL documentation cited here explains how parallel workers and per-worker memory affect resource use, and how to monitor activity and investigate plans. It does not establish a general-purpose pool-based control for isolating arbitrary application classes.
After diagnosing the actual bottleneck, test relevant parallel-query or resource-configuration changes in the specific deployment. Avoid treating work_mem as a total memory allowance for a query: it applies to individual operations and workers, and a complex query can perform multiple sort or hash operations. The cited documentation does not provide a universally safe value for work_mem, worker counts, or concurrent workload limits.
Best Value
- HPE ProLiant DL380 Gen10 2U Rack Server with Rail kit for Enterprise
- Dual (2) Xeon Gold 6148 20-Core 2.40 GHz, 27.5MB, Up To 3.70 GHz Turbo
- Memory: 256GB (8 x 32GB) DDR4 PC4-25600 3200MHz Unbuffered Memory
- Storage: 15.36TB (4 x 3.84TB) Enterprise 2.5” SATA III 6Gb/s SSDs for Ultra Fast Storage
- Hard drives and memory upgrades included separately, not installed, installation required.
Roll out changes as measured policies, not guarantees
- Capture current behavior. Record query activity, plans, host metrics, concurrency, waits, and the relevant engine-specific counters during representative load.
- Choose a narrow control. Match the policy to the identified bottleneck and workload. For SQL Server, classify only the intended sessions; for PostgreSQL, test settings that correspond to the observed plan or resource pressure.
- Change one thing at a time. Use a staged rollout and check both the target workload and ordinary application requests. A limit may protect one group while reducing its throughput or shifting pressure elsewhere.
- Validate and retain a rollback path. Compare before-and-after behavior under comparable concurrency. Keep the previous configuration available so operators can reverse a change that harms latency, throughput, or stability.
The vendor documentation describes mechanisms and monitoring, not a safe limit or guaranteed percentage improvement for an unspecified workload. Set policy values from measurements on the target engine, version, and deployment.
Quick Recap
Product prices and availability are accurate as of the date/time indicated and are subject to change. Any price and availability information displayed on Amazon at the time of purchase will apply.




