The Tool Desk
Outbyte PC Repair FREEClear out junk files and repair common Windows errorsFree Scan →Outbyte Driver Updater FREEScan for outdated or missing drivers - takes under a minuteDriver Scan →Memory-chip prices rise when demand for bits grows faster than qualified wafer, packaging and testing capacity. Prices fall when customers carry excess inventory or new fabs add output faster than demand. Because manufacturers have high fixed costs, small changes in average selling prices (ASPs), utilization and cost per bit can produce very large changes in operating profit—and therefore sharp stock moves.
AI data-center construction is currently reshaping that cycle. It is pulling more high-bandwidth memory (HBM), server DRAM and enterprise SSDs into the market, while HBM production consumes advanced capacity that could otherwise supply conventional DRAM.

As an Amazon Associate I earn from qualifying purchases.
The basic mechanism: bits, capacity and timing
Memory is sold in standardized units, so competition keeps prices close to the industry clearing price. A manufacturer can increase revenue in two ways: ship more bits or sell each bit at a higher ASP. The critical variable is whether industry supply can respond quickly enough when demand changes.
Free tools Windows power users keep installed
One-click scans. No signup required.
Supply is not simply the number of wafers a company says it will make. A usable supply calculation must include wafer starts, process yield, packaging throughput, test capacity, customer qualification and the product mix that customers actually require. A newly announced fab may add no saleable bits for years, while a packaging constraint can limit shipments even when wafer capacity exists.
#1 Best Overall

- Capacity per Module: 64MB
- Number of Pins: 72
- Type: EDO DRAM
- Form Factor: SIMM
- Manufacturer Warranty: Lifetime
Demand also arrives unevenly. Cloud providers may place large server orders, smartphone makers may reduce builds, and PC customers may destock at the same time. Those changes alter both the number of bits required and the mix of products that can command premium pricing.
- Shortage: demand exceeds qualified output, inventories fall and spot prices usually rise first.
- Balance: customer inventories and supplier output are aligned, so prices move gradually.
- Oversupply: inventories build, customers defer purchases and suppliers discount to keep fabs utilized.
Because fabs run continuously and cost billions to build, producers cannot instantly match output to demand. This mismatch creates the memory industry’s recurring boom-and-bust cycle.
Why AI changes the current cycle
AI servers use much more memory bandwidth and capacity than conventional servers. Training and inference systems require HBM alongside large amounts of server DRAM, while the associated data centers consume enterprise SSDs for model data, checkpoints and retrieval workloads.
Micron’s 2026 filing describes the imbalance directly: “The AI-driven growth in the data center has accelerated demand for memory and storage at a rate greater than our ability and the industry’s ability to increase supply.” That statement describes a capacity problem, not merely a temporary increase in orders.
HBM creates a product-mix constraint
HBM is built from stacked DRAM dies connected through advanced packaging. Its selling price and profit potential are higher than those of many conventional DRAM products, but it requires specialized process steps, known-good-die testing, advanced packaging and customer qualification.
When a supplier allocates scarce advanced capacity to HBM, fewer resources may remain for standard server, PC or mobile DRAM. The result can be a tight conventional-DRAM market even when total DRAM wafer capacity is expanding. HBM therefore affects prices in two directions: it adds high-value demand and can restrict the supply of other DRAM categories.
Samsung reported that limited supply, stronger conventional-DRAM demand, expanded HBM sales and higher prices drove record Memory Business revenue and operating profit in the fourth quarter of 2025. SK hynix likewise reported record 2025 results and emphasized AI-memory competitiveness and high-value products, including HBM.
Enterprise SSD demand follows the same pattern
AI clusters need fast storage for training data, model checkpoints and high-throughput serving. Enterprise SSDs use NAND flash rather than DRAM, but the business is exposed to the same supply-and-inventory cycle. A sudden increase in data-center orders can tighten premium enterprise NAND while consumer flash remains weaker.
DRAM and NAND are related but not interchangeable
| Characteristic | DRAM | NAND flash |
|---|---|---|
| Primary role | Working memory for CPUs, GPUs and servers | Persistent storage in SSDs, phones and other devices |
| AI exposure | HBM and high-capacity server memory are direct beneficiaries | Enterprise SSD demand rises with data-center storage and model workloads |
| Pricing behavior | Highly sensitive to server, PC and mobile build plans | Highly sensitive to SSD, client-device and enterprise-storage inventories |
| Key capacity constraints | Wafer process, advanced packaging, testing and HBM qualification | Layer transitions, wafer output, controller/firmware integration and SSD qualification |
| Typical investor question | Are bits and HBM capacity tight enough to lift ASPs? | Are inventories clearing, and is enterprise demand offsetting consumer weakness? |
A rally in DRAM does not automatically mean NAND will rally by the same amount. The two markets share manufacturers and some capital resources, but their demand, inventories and product qualifications differ.
Conventional DRAM versus HBM
Conventional DRAM is sold into broad markets such as PCs, smartphones and general-purpose servers. Volumes are large and products are relatively standardized, so price competition is intense. HBM is a premium, tightly qualified product whose supply depends on both memory dies and the packaging ecosystem.
Rank #2
- Demand visibility: HBM demand is tied to accelerator and AI-system deployments, while conventional DRAM tracks a wider set of device cycles.
- Qualification time: HBM customers must validate electrical, thermal and mechanical performance in a specific package and system.
- Capacity substitution: Moving equipment, engineering resources or packaging slots toward HBM can reduce conventional output.
- Pricing power: Scarcity and qualification barriers can support higher HBM ASPs, but only if yields and customer acceptance remain strong.
Investors should therefore ask not only how many total DRAM bits a company ships, but what proportion comes from HBM and other high-value products.
What’s actually slowing this PC down?
Pick the symptom - the matching free tool is one click away.
How ASPs, cost per bit and utilization determine margins
Memory profitability can be simplified as:
Operating profit ≈ (ASP per bit − variable cost per bit) × bits shipped − fixed operating costs.
This equation explains why margins swing so dramatically. A modest ASP increase expands the contribution from every bit already produced. At the same time, higher wafer utilization spreads depreciation, labor and facility costs across more saleable bits. When ASPs fall, the reverse happens: fixed costs remain while each bit contributes less.
What lifts gross margin
- Higher ASPs caused by tight supply or a richer product mix.
- Manufacturing improvements that reduce cost per bit.
- Better yields, which increase saleable output from each wafer.
- Higher utilization, which spreads fixed fab costs over more units.
- Growth in premium products such as HBM or enterprise SSDs.
What compresses gross margin
- Price discounts during oversupply or customer destocking.
- Low utilization that leaves depreciation under-absorbed.
- Expensive process transitions before yields mature.
- Inventory write-downs when older products cannot be sold at their recorded value.
- A product mix shift toward lower-priced consumer parts.
Micron’s 2025 filing attributed improved consolidated gross margin to higher ASPs, manufacturing cost reductions and inventory-related effects, while warning that ASP volatility can hurt the business. Inventory effects can help one quarter and reverse in another, so they should not be treated as a permanent improvement in structural profitability.
Inventory is the short-term price amplifier
Memory makers and their customers manage inventories at different points in the chain. A PC manufacturer may reduce orders while it sells existing modules; a cloud provider may maintain a strategic buffer; a distributor may react to spot prices within days. These decisions can make end-market demand look stronger or weaker than underlying consumption.
Destocking phase
When customers believe prices will fall, they delay purchases and consume inventory already on hand. Suppliers then see fewer orders, spot prices weaken and contract negotiations become more aggressive. Utilization can fall before final-device sales decline materially.
Rebuilding phase
Once inventories become lean, customers must reorder even if end demand is only recovering modestly. Orders can rise faster than consumption because several layers of the chain are replenishing at once. Spot prices often react first, followed by contract prices and reported ASPs.
The same mechanism works in reverse during a shortage: customers build safety stock, making demand appear even stronger and extending the price spike until supply catches up.
Spot prices and contract prices answer different questions
| Price type | What it reflects | How quickly it moves | Why it matters |
|---|---|---|---|
| Spot price | Near-term transactions for available inventory | Days to weeks | Early signal of tightness, panic buying or excess stock |
| Contract price | Negotiated purchases between suppliers and large customers | Weeks to quarters | Closer to the prices recognized in supplier revenue |
| Reported ASP | Company-wide realized price across products and regions | Quarterly | Combines market pricing with product mix, customer mix and currency effects |
A rising spot quote does not guarantee that a manufacturer’s next-quarter ASP will rise by the same percentage. Contracts, inventory purchased earlier and a changing product mix can delay or dilute the impact.
Crashes, No Sound, or Screen Glitches?
Random freezes, missing sound and display glitches usually trace back to one bad driver. Find and replace yours safely.Free scan · under a minuteWindows Errors? Fix Them Before They Spread
Repair common Windows errors and clear accumulated junk for a smoother, more stable PC - no reinstall needed.Free scan · no reinstallWhy memory stocks are more volatile than the chips
Equity investors price companies on expected future earnings, not just the current quarter. Memory earnings are unusually sensitive to assumptions about the next price cycle, so a small change in guidance can produce a large share-price move.
Rank #3
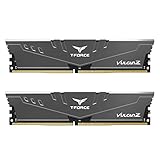
- Simple design to perfectly protect the cooling module with high thermal conductive adhesive
- Supports Intel & AMD motherboards
- Selected high-quality IC
- Supports XMP2.0
- Energy saving with ultra-low working voltage
The main transmission channels
- ASP revision: A higher or lower pricing outlook changes revenue on every expected bit.
- Bit shipments: Volume guidance reveals whether demand or supply is constraining sales.
- Cost per bit: Process shrinks and yield gains can protect margins when prices soften.
- Utilization: A fab running below efficient capacity absorbs fixed costs and lowers operating leverage.
- Product mix: More HBM or enterprise SSDs can raise blended ASPs, while consumer exposure can dilute them.
- Inventory: Write-down risk signals that current book values may not be recoverable.
- Capital expenditure: Aggressive new-fab spending may solve a shortage later but increase oversupply risk.
- Customer concentration: A few large cloud or device customers can influence orders and negotiating power.
In an upswing, scarce output means incremental pricing can flow quickly to profit because much of the cost base is fixed. In a downturn, the same leverage works against shareholders: lower ASPs and fewer shipped bits leave depreciation and other fixed costs in place.
Independent reader supportYour contribution helps us test, update, and keep practical guides available for everyone.What the latest company results illustrate
SK hynix reported 2025 revenue of 97.1467 trillion won and operating profit of 47.2063 trillion won, equivalent to a 49% operating margin for the year. Those figures demonstrate how a favorable mix of AI-memory products, strong pricing and high utilization can translate into exceptional profitability. They do not establish a permanent margin level for the industry; future results still depend on ASPs, costs, inventory and capacity.
Samsung’s fourth-quarter 2025 Memory Business report provides a similar example from a broader portfolio: limited supply, stronger conventional DRAM demand, expanded HBM sales and higher prices combined to produce record segment revenue and operating profit.
Recommended Free Tools
These announcements are best read as evidence of cycle position and product mix, not as guarantees that every DRAM or NAND category is tight.
How to read a memory company’s earnings release
- Start with bits shipped and ASP direction. Revenue growth from volume is different from growth caused by pricing.
- Separate product categories. Look for HBM, server DRAM, mobile DRAM, client SSD and enterprise SSD commentary.
- Check cost per bit and utilization. A company can defend margins through manufacturing improvements even when market prices weaken.
- Inspect inventory. Rising finished-goods inventory may indicate preparation for growth, or it may signal weak sell-through.
- Compare capital spending with qualified capacity. Announced wafers are not immediately saleable output.
- Read customer and supply language. Phrases such as “qualification,” “allocation,” “lead time” and “commitments” reveal how durable demand may be.
- Test the guidance against the cycle. Ask whether management is describing a quarter, a calendar year or a multi-year trend.
Current capacity versus future qualified capacity
Capacity announcements can move stocks before they affect physical supply. Construction, equipment installation, process ramp, yield improvement, packaging and customer qualification each add delay. A fab can be technically complete yet unable to ship the exact HBM stack, DRAM density or SSD configuration that a customer needs.
When assessing a proposed expansion, distinguish:
- Announced capacity: a public plan with no guaranteed near-term output.
- Installed capacity: equipment is in place but may still be ramping.
- Qualified capacity: products meet customer specifications and can be shipped at commercial yields.
- Effective capacity: qualified output after yield, packaging and product-mix constraints.
This distinction prevents a common error: assuming that future wafer starts will immediately end a current shortage.
Practical implications for buyers
For people building or upgrading systems, memory cycles affect availability and timing more than long-term technology choices. A DRAM module is a direct product category identified by Micron, while a NAND-based enterprise SSD is relevant to AI-server storage demand described by Micron and SK hynix.
Do these 3 things before closing this tab:
1Fix the driver behind crashes, sound loss and screen glitches2Repair Windows errors before they cause bigger problems3Scan for outdated or missing drivers - takes under a minute- Compare the exact capacity, speed, endurance and interface rather than relying on a generic “RAM” or “SSD” label.
- When prices are rising, check whether the increase is in spot listings or in contract-oriented products; retail prices can lag both directions.
- For enterprise deployments, secure qualification and supply commitments early because premium products may have longer validation cycles.
- Avoid assuming that a lower-priced consumer SSD is a substitute for an enterprise drive with different endurance, firmware and warranty requirements.
A decision framework for investors
Memory stocks are most attractive when several indicators align: inventories are lean but not panic-level, ASPs are firm, cost per bit is falling, utilization is rising and new capacity remains several quarters away from qualification. Risk increases when customers are carrying excess stock, suppliers are adding capacity aggressively and prices depend on a single premium product.
| Observation | Likely interpretation | Question to verify |
|---|---|---|
| Spot prices rise while inventories fall | Near-term shortage may be forming | Are contract prices and reported ASPs following? |
| Revenue rises but bits shipped fall | Pricing or product mix is doing the work | Is the mix shift sustainable? |
| Margins rise with utilization | Operating leverage is improving | Can utilization remain high if prices soften? |
| Capex accelerates | Suppliers expect demand or are defending technology leadership | When will the added output be qualified? |
| Customer inventory rises | Future orders may be delayed | Is the increase intentional safety stock or weak sell-through? |
What can end a price upswing?
A rally usually ends through a combination of demand normalization, customer inventory rebuilding, yield improvements and new qualified capacity. AI demand may continue growing while prices still weaken if suppliers collectively add enough HBM, server DRAM or enterprise SSD output. Conversely, prices can remain high even after announcements of expansion if packaging, testing or qualification remains constrained.
Do not treat any single quarter’s ASP, margin or shortage as a new permanent normal. AI-capital-spending plans, customer inventories, pricing and capacity guidance can change quickly, so company filings should be checked again when making a current investment or procurement decision.
The central takeaway
Memory prices are governed by the speed mismatch between demand for bits and the industry’s ability to produce, package and qualify those bits. AI is intensifying that mismatch through HBM, server DRAM and enterprise SSD demand, while HBM allocation can tighten conventional DRAM. Margins then magnify the cycle because ASPs, cost per bit and utilization act on a capital-intensive fixed-cost base. Stock volatility is the market’s forward-looking response to those changing assumptions about prices, inventory, product mix and future capacity.
Quick wins for a faster PC:
Repair Windows errors before they cause bigger problemsFix Now →Scan for outdated or missing drivers - takes under a minuteDriver Scan →Clear out junk files and repair common Windows errorsFree Scan →Quick Recap
Product prices and availability are accurate as of the date/time indicated and are subject to change. Any price and availability information displayed on Amazon at the time of purchase will apply.

