The fairest way to compare Asian Paints with Indian paint stocks is to separate five questions: how fast each business is growing, how much of that growth comes from volume rather than price, how profitable and cash-generative the operations are, what mix of decorative and industrial coatings drives the numbers, and what valuation the market is already assigning. Asian Paints is the scale reference in a concentrated market, but a higher historical growth rate or a lower earnings multiple does not by itself make another stock superior.
Start with a comparable peer set and accounting basis
Use consolidated, audited annual figures for Asian Paints, Berger Paints, Kansai Nerolac, Indigo Paints and Akzo Nobel India. Keep the fiscal periods, accounting standards, currency units and continuing-operations definitions consistent. Add JSW Paints or another entrant only when it reports a comparable period and sufficiently detailed consolidated disclosures.
As an Amazon Associate I earn from qualifying purchases.
This matters because paint companies do not all have the same exposure. Asian Paints is predominantly a decorative and home-décor business, while Kansai Nerolac has a substantial industrial orientation. Comparing a decorative-heavy company with an industrial-heavy company on a single headline margin can therefore produce a misleading ranking.
Do these 3 things before closing this tab:
1Repair Windows errors before they cause bigger problems2Scan for outdated or missing drivers - takes under a minute3Clear out junk files and repair common Windows errors| Company | Use in the comparison | Important comparability check |
|---|---|---|
| Asian Paints | Large-scale decorative and home-décor reference company | Use consolidated annual figures and identify decorative, international and other businesses separately |
| Berger Paints | Large decorative coatings peer | Match consolidated scope, fiscal year and treatment of subsidiaries |
| Kansai Nerolac | Major peer with meaningful industrial exposure | Separate industrial and decorative segments before comparing margins or growth |
| Indigo Paints | Decorative coatings growth comparison | Check whether rapid revenue growth is accompanied by durable volume, cash flow and returns |
| Akzo Nobel India | Listed coatings peer with a different mix and scale | Use the same period and consolidated basis; do not infer comparability from brand presence alone |
| JSW Paints | Potential entrant or additional reference | Include only where period and disclosure basis match the listed peers |
A SEBI filing groups Asian Paints, Berger Paints and Kansai Nerolac as companies holding more than approximately 80% of the Indian paint market together. That is a concentration observation, not an individual market-share figure for any one company. Treat reported share estimates as directional unless the companies disclose the same methodology and period.
#1 Best Overall
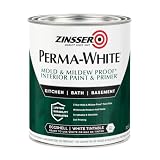
- Self-Priming formula - requires no sanding
- Mold & Mildew-Proof paint film - guaranteed for 5 years
- Resists dirt and moisture on film coating
- Finish is washable and scrubbable with soap and water
- Product contains a mildewcide to prevent the growth of mold and mildew on the paint film only
Compare growth without confusing price with demand
Use revenue CAGR as a first screen
The cited SEBI table reports the following revenue compound annual growth rates for FY2019 through FY2024:
| Company | FY2019–FY2024 revenue CAGR | How to read it |
|---|---|---|
| Asian Paints | 13.02% | Strong multi-year expansion, but the figure combines volume, price, mix, acquisitions and currency effects |
| Berger Paints | 13.06% | Almost the same reported CAGR as Asian Paints over this period; inspect the sources of growth before declaring a winner |
| Kansai Nerolac | 7.54% | Lower reported CAGR among the named large peers; industrial cycles and mix can affect the comparison |
| Akzo Nobel India | 6.30% | Lowest CAGR in this cited group; scale and business mix need to be considered |
| Indigo Paints | 21.72% | Highest CAGR in the cited table; test whether the pace is repeatable and supported by cash generation and returns |
These are historical revenue CAGRs, not forecasts and not a ranking of future stock returns. They also do not establish like-for-like volume growth. A period containing large raw-material inflation or price increases can show high revenue growth even when physical volumes are modest.
Split growth into volume, price and mix
For each company, record reported volume growth, price or realization changes, product mix and currency effects where management provides them. A useful bridge is:
- Volume: litres or other physical units sold, preferably on a like-for-like basis.
- Price: list-price changes, discounts and the effect of passing raw-material inflation through to customers.
- Mix: movement toward premium products, economy products, waterproofing, construction chemicals or other categories.
- Scope: acquisitions, divestments, new subsidiaries and international operations.
Decorative demand is influenced by repainting, housing completion, festivals, weather and consumer confidence. Industrial demand follows vehicle production, durable goods, infrastructure and other manufacturing cycles. A company can outperform in revenue because one segment is temporarily strong while another is weak, so segment-level growth is more informative than the consolidated percentage alone.
Check the quality and durability of growth
After calculating the CAGR, compare the most recent two or three years with the full-period rate. Look for a pattern in which volume growth remains positive after price increases fade. Also check whether receivables, inventory and capital expenditure are rising proportionately. Fast sales growth accompanied by weak operating cash flow may reflect working-capital absorption rather than a durable improvement in economics.
Rank #2

- PAINT + PRIMER IN ONE: Evolve’s paint-and-primer formula helps you get great coverage from the start, sealing your surface and reducing the extra work of multiple coats.
- AVAILABLE IN MULTIPLE SHEENS, COLORS & SIZES: Choose from a curated palette of designer colors in Flat, Eggshell, Satin, and Semi-Gloss sheens to match any style, room, or project. Available in 1-Gallons & 5-Gallons.
- EGGSHELL SHEEN – Soft, Velvety Glow: Offers a gentle sheen that balances elegance with durability. Ideal for moderate-traffic areas like dining rooms, hallways, and family rooms. Easy to clean without compromising the finish.
- STAIN & SCRUB RESISTANT: Built to last in real spaces, Evolve helps resist marks, scuffs, and water spotting, so your home continues to look polished and well-maintained.
- DESIGNED FOR MOISTURE-PRONE AREAS: Formulated to perform well in bathrooms, kitchens, entryways, laundry rooms, and other high-humidity spaces.
Measure profitability and capital efficiency on the same definition
Use more than one margin
Track gross margin, EBITDA margin, EBIT margin and net margin. Gross margin shows pricing power and raw-material exposure; EBITDA margin includes operating leverage but excludes depreciation; EBIT incorporates the cost of the plant and equipment; net margin includes finance costs, taxes and non-operating items.
Asian Paints’ FY2025-26 annual-report page gives EBITDA of ₹7,113.1 crore for Asian Paints Limited, FY2025-26. The same cited annual-report material gives 28.4% ROCE for FY2025. Those figures should not be compared mechanically with a peer’s differently defined year, standalone accounts or adjusted EBITDA. Build a like-for-like table first.
Recommended Free Tools
| Metric | Calculation or check | Question it answers |
|---|---|---|
| Gross margin | (Revenue − cost of goods sold) ÷ revenue | How much pricing and product economics remain after materials and manufacturing inputs? |
| EBITDA margin | EBITDA ÷ revenue | What operating earnings are generated before depreciation and financing? |
| EBIT margin | EBIT ÷ revenue | How do operating profits look after asset depreciation? |
| ROCE | Operating profit ÷ capital employed, using the company’s stated convention | How efficiently is the business using long-term capital? |
| ROE | Profit attributable to shareholders ÷ average equity | What return is generated on shareholders’ capital? |
| Operating cash conversion | Cash flow from operations ÷ EBITDA or EBIT, with the denominator stated | Are accounting profits turning into cash? |
Normalize ROCE and ROE before ranking companies
ROCE can vary depending on whether a company uses average or closing capital employed, includes leases, treats goodwill consistently and uses EBIT or another operating-profit measure. Record the published definition beside each number. If definitions differ, calculate a common version from audited statements and show the assumptions.
ROE is affected by leverage and buybacks. A highly leveraged company may report a higher ROE without having better operating economics, while a cash-rich company can show a lower ROE because its equity base is larger. Review net debt, lease liabilities, minority interests and cash balances alongside both ratios.
Look for margin resilience, not just the peak
Plot at least five years of gross margin and EBITDA margin. A resilient company holds margins through raw-material swings, competitive discounting and weak demand. A one-year peak can result from unusually low input costs, inventory gains or temporary price increases. Compare management commentary with the financial statements to identify whether an improvement is structural or cyclical.
Rank #3

- Use for a variety of indoor and outdoor project surfaces including wood, metal, plaster, masonry or unglazed ceramic
- Water-based acrylic formula is low odor, resist chips and provides long-lasting protection
- Covers up to 120 sq ft and dries to touch in 30 minutes for quick project completion
- Semi-gloss finish minimizes surface imperfections, goes on smoothly and provides excellent hide
- Prior to application sand surfaces with 180/200 grit sandpaper, then wash with a degreaser, allow the surface to dry and apply paint
Adjust for decorative, industrial and international mix
Asian Paints reports ₹30,830.4 crore of decorative and home-décor revenue for FY2025-26, equal to 86.8% of revenue, according to its annual-report page. This makes it primarily a decorative comparison when evaluating consumer repainting, dealer distribution, tinting equipment and premiumization.
Kansai Nerolac’s official 2024 release estimates India’s domestic paint industry at about ₹75,000 crore as of March 2024. The estimate is a market-size reference, not a directly comparable company-revenue figure. Kansai Nerolac’s industrial exposure means its segment mix should be separated before comparing margins, growth or cycle sensitivity with a decorative-heavy company.
| Mix question | Why it changes the comparison | Evidence to collect |
|---|---|---|
| Decorative versus industrial | Decorative repainting can have different margins, seasonality and distribution economics from industrial coatings | Segment revenue, segment profit, volume and end-market commentary |
| Domestic versus international | Currency, inflation, regulation and competitive conditions differ by country | Geographic revenue, operating profit and currency effects |
| Premium versus economy products | Premiumization can lift realization and margin without equivalent volume growth | Product-category mix, average realization and management disclosures |
| Paints versus adjacent décor | Décor products may expand the addressable market but have different working-capital and margin profiles | Revenue and profitability by business line |
When a peer has a large industrial business, compare its decorative segment with Asian Paints’ decorative segment where disclosures permit, then compare consolidated results separately. If a segment number is not disclosed on a consistent basis, mark it as “not stated” rather than estimating it from group revenue.
Evaluate competitive position beyond reported market share
Market share is useful only when the denominator, geography, product categories and measurement date are known. A company can defend share through a wider dealer network, faster service, stronger tinting-machine penetration, better contractor relationships or a broader product range. Those advantages can support pricing and reduce the cost of acquiring demand, but they should be tested against margins and cash returns.
- Dealer reach and productivity: assess outlet additions, sales per dealer and the cost of servicing the network.
- Tinting machines: examine installed base, utilization and whether the equipment locks in repeat purchases or simply raises capital needs.
- Product breadth: compare interior and exterior paints, waterproofing, construction chemicals, wood finishes and premium categories.
- Repainting versus new construction: repainting can provide a recurring demand base, while new construction is more tied to housing starts and project cycles.
- Raw-material sensitivity: review crude-linked inputs, solvents, resins, titanium dioxide and packaging exposure, as well as the lag before price changes reach customers.
- Competitive pricing: monitor discounting, channel incentives and whether volume gains require lower realization.
Asian Paints’ FY2024-25 annual report described the year as challenging and said the domestic coatings industry recorded revenue decline ranging from low-single-digit degrowth to flat performance. Amit Syngle, Managing Director and CEO, called it “a challenging and rigorous year for the entire domestic coatings industry despite the steady levels of overall economic activity in the country.” Use that context when interpreting a single weak year: an industry slowdown can affect every peer, while differences in execution still show up in volume, margins, inventory and cash flow.
Quick wins for a faster PC:
Repair Windows errors before they cause bigger problemsFix Now →Scan for outdated or missing drivers - takes under a minuteDriver Scan →Clear out junk files and repair common Windows errorsFree Scan →Rank #4

- ALL-IN-1 PAINT & PRIMER: A hardy multi-purpose and multi-surface one-coat paint and primer in one for almost any indoor or outdoor surface. A wall, ceiling, floor, skirting board, cabinet, furniture and door paint for your bathroom, kitchen, home and garden.
- DURABLE & VERSATILE: A highly pigmented, thick formula available in 12 bold colors and a Matte, Satin or Gloss finish. Ideal for interior and exterior paint jobs on wood, laminate, plastic/UPVC, metal, concrete, brick, masonry, stone, glass and more.
- EFFECTIVE MONEY & TIME SAVER: A quick painting solution for DIY or professional builders and painters; our luxuriously opaque formula requires just 1 coat and is fast drying for a premium finish.
- ADVANCED ECO FORMULA: Our UK-made chalk paint is water-based, non-toxic, low odor, and has low VOCs for an environmentally friendly decorating choice.
- EASY APPLICATION: Remove dirt with a damp cloth, wipe the surface clean and dry, sand/score the surface (optional based upon the finish required), stir to mix the color and paint with a brush or roller.
Compare valuation only after normalizing the operating data
Use price-to-earnings, enterprise value-to-EBITDA and price-to-book as complementary measures. None is sufficient on its own.
| Multiple | Best use | Main limitation |
|---|---|---|
| P/E | Comparing equity value with normalized earnings when capital structures are similar | Distorted by one-off items, tax rates, leverage and cyclical earnings |
| EV/EBITDA | Comparing operating value before financing and depreciation differences | Ignores maintenance capital expenditure and working-capital intensity |
| Price-to-book | Useful alongside return metrics for asset-heavy or balance-sheet-sensitive businesses | Book value may not capture brand, distribution and internally built intangible advantages |
Refresh the share price, net debt, share count and consensus estimates at the time of publication. The historical revenue CAGRs and the reported Asian Paints figures above do not provide a live market multiple or an investment recommendation. A premium valuation can be justified when growth, margins, returns, cash conversion and competitive durability are superior; it becomes vulnerable when the premium assumes growth that the operating data no longer support.
Use a normalized denominator
For P/E and EV/EBITDA, use a normalized earnings estimate rather than a peak or trough year. Adjust for clearly disclosed exceptional items, but do not remove recurring costs simply to improve the multiple. For EV, include interest-bearing debt, leases where consistently treated, minority interests and subtract surplus cash using the same policy for every company.
Build a valuation-versus-quality matrix
Place each company on two axes: operating quality and valuation. Operating quality can combine five-year margin stability, ROCE, cash conversion, volume growth and balance-sheet strength. Valuation can combine forward P/E, EV/EBITDA and price-to-book against the company’s own history and the peer median. This prevents a low multiple from automatically being labeled cheap or a high multiple from automatically being labeled expensive.
A repeatable comparison workflow
- Fix the period: choose the same fiscal years, preferably the latest audited year plus at least four earlier years.
- Fix the scope: use consolidated accounts for every company, and document any exceptions.
- Download the annual reports: capture revenue, EBITDA, EBIT, profit, operating cash flow, capital expenditure, net debt, equity and segment data.
- Calculate growth: compute revenue CAGR and record reported volume growth, price and mix separately.
- Split the business: classify decorative, industrial, international and adjacent décor revenue where disclosed.
- Standardize profitability: calculate gross margin, EBITDA margin, EBIT margin and net margin with identical denominators.
- Standardize returns: reconcile ROCE and ROE definitions, then review leverage and cash balances.
- Test cash quality: compare operating cash flow with EBITDA, inspect receivables and inventory days, and note large working-capital swings.
- Assess the moat: document dealer reach, tinting infrastructure, product breadth, repainting exposure, pricing and raw-material sensitivity.
- Apply valuation: update market prices and consensus estimates, calculate P/E, EV/EBITDA and price-to-book, and compare each multiple with growth and quality.
Keep a source note beside every data point, including fiscal year, consolidated or standalone scope, reported or calculated status and the company’s definition. This makes revisions auditable when a company restates a segment or changes its reporting format.
Best Value

- WHAT'S IN THIS 10 PIECE PAINT KIT FOR WALLS: includes one plastic paint tray; one 9 inch roller frame; one 4 inch mini roller frame; two 9 inch microfiber roller covers (1/2 inch nap); two 4 inch microfiber roller covers (1/2 inch nap); one 1 inch flat brush; one 1.5 inch angle sash brush; one 2 inch angle sash brush
- Versatile Application: Perfect for any project, this set includes paint rollers 9 inch for large surfaces and smaller brushes for detail work
- All-in-One Kit: This paint brush set and paint tray combo ensures you have all the paint supplies needed for any home improvement task
- Professional Grade: Get a smooth, even finish with our high-quality paint roller set; ideal for applying interior paint gallon or smaller quantities
- Cost-Effective: This paint brush and roller set provides unbeatable value; includes paint pan and paint trays for easy cleanup and reuse
Common comparison mistakes and how to correct them
- Ranking by revenue CAGR alone: add volume, realization, mix, cash conversion and returns.
- Mixing standalone and consolidated accounts: choose one basis and use it for all peers.
- Comparing different fiscal periods: align the year-end dates or clearly label the mismatch.
- Treating market share as identical across sources: check the definition, geography, product scope and measurement date.
- Ignoring industrial exposure: compare segments before drawing conclusions about margins or cyclicality.
- Using a single-year margin: review a multi-year range and the raw-material cycle.
- Calling a premium multiple irrational without a quality test: relate valuation to growth durability, ROCE, cash generation and balance-sheet risk.
- Calling the fastest historical grower the best stock: test the base effect, current scale, reinvestment needs and sustainability of demand.
- Using management-adjusted figures without reconciliation: show reported numbers first and explain every adjustment.
How to interpret the results for different investor questions
“Which company had the fastest historical growth?”
In the cited FY2019-FY2024 SEBI table, Indigo Paints had the highest revenue CAGR at 21.72%. That answers a historical growth question only. It does not answer whether the rate can persist, whether growth was volume-led or whether the stock is attractively valued.
“Which company has the best margins?”
Use a common fiscal year, consolidated scope and identical margin definitions. Then examine margin stability, segment mix and cash conversion. A decorative-heavy company and an industrial-heavy company should not be ranked on consolidated EBITDA margin without that context.
“Is Asian Paints worth its valuation premium?”
Compare the premium with measurable advantages: scale, decorative share, distribution, product breadth, volume growth, margin resilience, ROCE, operating cash conversion and balance-sheet risk. The answer changes with the current share price and earnings estimates, so historical operating figures alone cannot settle it.
Free tools Windows power users keep installed
One-click scans. No signup required.
“Should I include a newer entrant?”
Include it only when the reporting period, accounting basis and segment disclosure are comparable. If the company provides only a partial period or materially different metrics, show it in a separate context section rather than forcing a peer ranking.
What a defensible conclusion looks like
A sound comparison does not produce one universal winner. It identifies the trade-off the market is pricing. Asian Paints is the largest-scale reference in a concentrated market, with 86.8% of FY2025-26 revenue reported from decorative and home décor and a cited FY2025 ROCE of 28.4%. Berger Paints offers a closely matched historical revenue-growth reference in the cited period. Indigo Paints recorded the fastest historical revenue CAGR in that table. Kansai Nerolac and Akzo Nobel India require especially careful mix and scale analysis, while JSW Paints belongs in the set only where disclosures are comparable.
The final ranking should therefore be built from aligned numbers, not a single headline statistic: historical and current volume growth, price/mix, segment economics, margin durability, ROCE, cash conversion, competitive intensity, balance-sheet risk and the valuation required to own each business. Update the market-price and consensus portions immediately before making any current valuation statement.
Quick Recap
Product prices and availability are accurate as of the date/time indicated and are subject to change. Any price and availability information displayed on Amazon at the time of purchase will apply.

