Windows Errors? Fix Them Before They Spread
Repair common Windows errors and clear accumulated junk for a smoother, more stable PC - no reinstall needed.Free scan · no reinstallOutdated Drivers Are Slowing You Down
One free scan finds every outdated or missing driver and matches the right update for your exact hardware.Free scan · exact hardware matchChoose inference hardware by working outward from the production workload: define the model, traffic, and service-level objectives (SLOs); confirm that weights and runtime state fit in memory; then benchmark viable configurations with the intended serving stack. Pick the least costly option that meets the latency, throughput, reliability, and availability requirements—not the accelerator with the biggest peak specification.
What should you define before choosing hardware?
The same model can need different infrastructure depending on prompt and response lengths, concurrency, request rate, and latency targets. AWS recommends basing throughput sizing on traffic that resembles production. Record these inputs before comparing accelerators:
As an Amazon Associate I earn from qualifying purchases.
- Model: model name or architecture, parameter count, and any model-specific serving requirements.
- Precision and serving software: the intended precision or quantization, inference backend, tokenizer, and relevant software versions.
- Input and output: typical and maximum prompt length, expected generated-output length, and the maximum context the application actually needs.
- Traffic: requests per second, expected concurrency, average and peak demand, and whether traffic arrives steadily or in bursts.
- Service objectives: target time to first token (TTFT), inter-token latency, end-to-end latency, acceptable queueing, availability, and error tolerance.
Keep the latency measures separate. TTFT measures the wait for the first generated token; inter-token latency describes the pace of subsequent tokens; end-to-end latency covers the full request. Throughput and request rate answer different questions again. AWS’s inference sizing guidance explains why prompt length, response length, concurrency, and latency requirements change the infrastructure needed for a model.
Quick wins for a faster PC:
Scan for outdated or missing drivers - takes under a minuteDriver Scan →Repair Windows errors before they cause bigger problemsFix Now →Fix the driver behind crashes, sound loss and screen glitchesFind Drivers →Will the model and its runtime state fit in accelerator memory?
Memory capacity is an eligibility check, not a performance score. Account for model weights, activations, serving-runtime overhead, and the key-value (KV) cache. The KV cache grows with context length and concurrent or batched requests, so a model that fits by weights alone may not fit under the intended serving load. Google Cloud’s inference best practices discuss memory sizing and the effect of KV cache on serving capacity.
#1 Best Overall

- NVIDIA Volta GV100 Architecture — 4,608 CUDA Cores, 640 1st-Gen Tensor Cores delivering 14 TFLOPS FP32 and 112 TFLOPS deep learning performance for AI training, inference, HPC, and scientific computing workloads
- 32GB HBM2 ECC Memory — 900 GB/s Bandwidth — High-bandwidth memory on a 4096-bit bus with ECC error correction provides the memory capacity and throughput required for the largest AI models, simulations, and datasets
- PCIe 3.0 x16 Interface — 250W TDP — Standard PCIe Gen3 connectivity with passive cooling designed for enterprise rack server deployment in HPE ProLiant, Dell PowerEdge, and Supermicro platforms with adequate chassis airflow
- NVLink — Scale to 96GB Unified Memory — Connect two V100 GPUs via NVLink at 300 GB/s bi-directional bandwidth to scale GPU memory from 32GB to 96GB for larger AI training and HPC workloads
- Multi-Precision Computing — Supports FP64 (7 TFLOPS), FP32 (14 TFLOPS), FP16 (112 TFLOPS) and INT8 precision modes for flexible deployment across training, inference, and scientific simulation workloads
Use the application’s real maximum context rather than an unnecessarily generous setting. If the application does not need a large maximum context, reducing it can free memory for KV cache and may allow more concurrent requests. Validate the resulting capacity under load; a theoretical fit does not establish that the service will meet its latency or throughput targets.
How do I shortlist inference GPUs and decide whether to use multiple?
Start with deployment shape. A smaller model or single-host service may fit a general-purpose GPU; larger models or higher-scale services may require multiple accelerators, clustered infrastructure, and a communication fabric suited to the workload. Google Cloud distinguishes general GPUs from clustered GPU infrastructure by factors that include management and networking, and documents choices spanning L4 and T4 GPUs through A100, H100, H200, B200, and GB-series systems. These are provider offerings, not a universal performance ranking. See its guidance on general versus clustered GPUs and accelerator infrastructure.
Rank #2
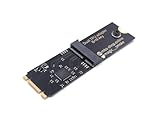
- Designed exclusively for Coral M.2 Accelerator with Dual Edge TPU modules to maximize AI inference performance.
- Fits standard M.2 2280 B-key or M-key slots (PCIe protocol only - not compatible with SATA M.2).
- Bidirectional Gen2 bandwidth: Upstream: ×1 PCIe Gen2 (5Gbps) Downstream: Dual ×1 PCIe Gen2 lanes
- Includes stainless steel mounting screw for vibration-resistant PCB fixation.
- Explicitly incompatible with Raspberry Pi CM4/USB enclosures - prevents buyer errors.
For multi-GPU or multi-host serving, check whether communication between accelerators and across hosts is part of the bottleneck. Network and interconnect needs depend on the model and serving layout; adding accelerators does not by itself guarantee better end-to-end performance. NVIDIA’s Inference Reference Architecture covers inference-system design considerations, while Google Cloud’s infrastructure guidance describes different deployment approaches.
Free tools Windows power users keep installed
One-click scans. No signup required.
Use published figures as screening evidence, not a winner list
The figures below come from provider documentation and illustrate different kinds of evidence. Specifications are not workload benchmarks, and relative comparisons are not current prices or vendor-neutral results.
Rank #3

- 900-2G193-0000-000
| Evidence | Reported value | How to interpret it |
|---|---|---|
| Google Cloud L4 in G2, 2024 documentation | 24 GB accelerator memory | Provider-published capacity; check the configuration and serving overhead relevant to your deployment. Google Cloud’s LLM-serving article. |
| Google Cloud H100 in A3, 2024 documentation | 80 GB accelerator memory | Provider-published capacity, not a guarantee that a particular model and request profile will fit or meet an SLO. Google Cloud’s LLM-serving article. |
| Google Cloud H200 in A3 Ultra, current documentation accessed in 2026 | 141 GB accelerator memory | Provider-published capacity; availability and instance configuration can vary. Google Cloud’s infrastructure guidance. |
| Google Cloud L4 serving specifications, 2024 | 300 GB/s bandwidth and 242 TFLOPS peak mixed-precision compute, with structural sparsity | Google Cloud states that the table’s values without structural sparsity are half as high. These are published specifications, not a workload benchmark. Google Cloud’s LLM-serving article. |
| AWS illustrative relative comparison, current guidance accessed in 2026 | L4: 1.0× throughput / 1.0× cost; L40S: 2.5× / 1.7×; H100: 3.5× / 3.0×; H200: 3.8× / 3.5× | These are AWS’s illustrative relative figures, not a vendor-neutral benchmark or current quote. Treat them as specific to the comparison in AWS guidance, not a forecast for your workload. AWS right-sizing guidance. |
| Google Cloud example, 2024 | A3 reports 13.8× prefill throughput versus G2 at 5.5× the cost for the depicted setup | The result belongs to Google’s particular benchmark configuration and should not be generalized to other models, traffic, or pricing. Google Cloud’s LLM-serving article. |
How should you benchmark candidates?
Benchmark the service you plan to operate, rather than comparing hardware using a peak specification or an unrelated model test. LLM prefill (processing the input prompt) and decode (generating output tokens) have different performance demands. Prompt and output lengths can therefore shift the bottleneck between compute, memory bandwidth, memory capacity, and communication. AWS’s guidance says throughput sizing should use production-like workload shapes; Google Cloud’s LLM-serving comparison provides a specific example of prefill performance that is tied to its test setup.
- Fix the test configuration. Use the target model, tokenizer, precision or quantization, inference backend, hardware configuration, and software versions.
- Represent real traffic. Match the expected prompt and output length distributions, context limits, concurrency, request rate, and cache state. Include peak or burst conditions if they matter to the SLO.
- Measure user-relevant outcomes. Record TTFT, inter-token latency, end-to-end latency, generated tokens per second, request rate, and errors under load. Include tail latency where the service objectives depend on slow requests.
- Record provenance. Save the model and software versions, hardware, workload profile, concurrency, and cache conditions alongside each result so another run can reproduce the comparison. NVIDIA’s reference architecture is a useful resource for system-level inference considerations.
- Retest viable candidates at the target load. A configuration that performs well at light load may miss its SLO when concurrency or queueing rises. Compare results at the same workload conditions before drawing conclusions.
How do you compare cost and operational fit?
First remove candidates that fail the memory-fit check or miss an SLO in representative tests. For the remaining options, compare cost per useful output—such as cost per million generated tokens—at the measured load, alongside utilization and scaling behavior. A low hourly rate is not a low serving cost if the configuration needs more accelerators or fails to deliver usable throughput.
Rank #4

- High-Performance ML Accelerator: Integrates Edge TPU, delivering 4 TOPS (int8) peak performance for machine learning inference tasks.
- Strong Compatibility: Supports M.2 A+E key interface for easy integration into existing systems.
- Low Power Design: Provides 2 TOPS per watt, ideal for embedded and energy-efficient applications.
- Wide OS Support: Compatible with Linux (Debian 10/Ubuntu 16.04+) and Windows 10 (64-bit).
- Industrial-Grade Reliability: Operating temperature range of -20°C to +85°C, suitable for harsh environments.
- Performance per cost: use the measured model and traffic profile, not a provider’s relative comparison as a substitute for your own result.
- Scaling and availability: check whether the required capacity is available where you will deploy it, how it scales with demand, and what reservation or capacity options apply.
- Operations: account for the effort of managing a single host versus clustered infrastructure, including networking, deployment, monitoring, and failure recovery.
- Software fit: verify that the intended inference backend and model configuration work with the candidate hardware and its supported software ecosystem.
Choose the lowest-cost configuration that meets the stated objectives in representative tests and has an operating model your team can support. Current instance pricing and availability should be checked for the deployment region and date; neither is established by relative benchmark figures.
What information is needed for a specific hardware recommendation?
A defensible GPU count or instance recommendation requires workload details that are not fixed by the title alone. Use this worksheet to prepare a shortlist and make the benchmark repeatable:
| Input to supply | Record |
|---|---|
| Model and serving configuration | Model or architecture, parameter count, precision or quantization, tokenizer, inference backend, and software versions. |
| Request shape | Typical and maximum input length, expected output length, maximum application context, and cache conditions. |
| Traffic profile | Average and peak requests per second, target concurrency, and whether demand is steady, bursty, or seasonal. |
| Service objectives | TTFT, inter-token latency, end-to-end latency, acceptable queueing, error tolerance, and availability target. |
| Deployment constraints | Region, single-host or multi-host preference, scaling needs, operations capability, and budget. |
| Benchmark result | TTFT, inter-token and end-to-end latency, generated tokens per second, request rate, errors, tail behavior, and cost at target load, with the full test setup recorded. |
Without those inputs and measurements, an exact GPU count, model-to-instance mapping, or lowest-cost SKU cannot be responsibly named. Once they are available, the decision is a comparison of tested configurations against the workload and its SLOs—not a universal ranking of accelerator models.
Quick Recap
Product prices and availability are accurate as of the date/time indicated and are subject to change. Any price and availability information displayed on Amazon at the time of purchase will apply.




