Recommended Free Tools
El Niño redistributes tropical rainfall and is associated with recurring wet and dry tendencies in some regions—but it does not guarantee rain or drought in any particular place. The useful way to read a set of four rainfall maps is to check the season, El Niño phase, measurement and reference period, and whether each map summarizes past observations or forecasts a future season.
What El Niño tends to do to rainfall
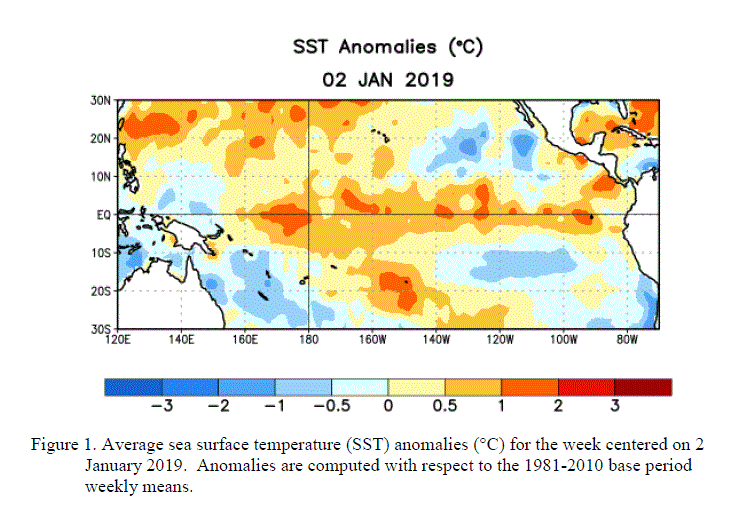
El Niño is associated with warmer-than-average sea-surface temperatures in the central and eastern equatorial Pacific. The shift in tropical atmospheric circulation that accompanies it is linked to more rainfall over parts of that Pacific region and less over Indonesia and nearby areas. The rainfall response is not uniform around the globe: it varies by season and region.
As an Amazon Associate I earn from qualifying purchases.
NOAA’s Climate Prediction Center (CPC) describes these broad historical associations:
Crashes, No Sound, or Screen Glitches?
Random freezes, missing sound and display glitches usually trace back to one bad driver. Find and replace yours safely.Free scan · under a minuteWindows Errors? Fix Them Before They Spread
Repair common Windows errors and clear accumulated junk for a smoother, more stable PC - no reinstall needed.Free scan · no reinstall- Tropical Pacific: wetter-than-normal conditions across the east-central and eastern Pacific.
- Maritime Southeast Asia and nearby regions: drier-than-normal conditions over Indonesia, the Philippines and northern Australia.
- December–February: wetter tendencies along coastal Ecuador and northwestern Peru, in southern Brazil and central Argentina, and in equatorial eastern Africa; drier tendencies over northern South America, Central America and southern Africa.
- June–August: wetter tendencies in the intermountain regions of the United States and in central Chile; drier tendencies in eastern Australia.
These are recurring seasonal associations, not an exhaustive global forecast. NOAA cautions that “Stronger El Niño events do not ensure strong impacts; they can only make certain impacts more likely.” A regional tendency cannot establish what will happen in a particular year or explain an individual rainfall event on its own.
#1 Best Overall

- 🔍Perfect Size for Learning: 13 inch world globe meets the needs of both children's learning and adult teaching. Earth globe precisely marking the boundaries of over 200 countries/regions, islands and ocean currents, making it easy to explore geographical details
- ✍️Waterproof Surface for Writing: High-definition coated surface allows marking of capitals and travel routes with a marker pen, which can be wiped clean with a damp cloth without leaving any trace.World globe for kids enables children to repeatedly practice geographical knowledge and teachers to mark teaching highlights
- 🔄360° Rotating Stable Stand: Arched ABS stand and thickened durable base can withstand frequent rotation by children and prevent toppling or shaking during rotation. Widened base keeps this world globe for kids stable on desks
- 🛡️Unbreakable & Fade-Proof: Globe for children is made of high-quality materials (not cheap matte coatings). World globe has high-quality printing that does not fade and can withstand drops and scratches
- 🎁Educational Enlightenment Gift: Interactive globe encourages curious children to explore the world of science, which can stimulate their desire to explore and increase interaction between parents and children. It is the top choice for gifts on birthdays, Christmas, school openings and other festivals
How to read four rainfall maps
A map can look decisive while leaving out details needed to interpret it. Read its caption and legend before comparing colors. Each map should make clear the following:
- Season: Which months or three-month season does it show? Rainfall patterns associated with El Niño shift over the annual cycle.
- ENSO phase or event: Is it an El Niño composite, a La Niña or neutral comparison, or one named historical event?
- Quantity and units: Does the shading show a precipitation anomaly, a percentage of normal, or another measure? An anomaly is a difference from a reference average, not the same thing as percent of normal.
- Reference period: Which years define the comparison average, and what years of observations went into the map?
- Map type: Does it summarize observed past events, or show forecast probabilities for a future season?
- Geographic scope: Is it a global composite, a regional product, or a set of measurements from specific stations?
Historical composites are not forecasts
A historical composite combines observations from past El Niño periods to show an average pattern. A forecast outlook instead estimates the probability of seasonal conditions ahead. A composite can help explain a recurring relationship, but it does not predict the exact rainfall for the next El Niño. Captions should identify which kind of map is being shown and, for a forecast, include its issue date and probability information.
Rank #2

- High Quality: Our earth globe is made of high-quality plastic. After testing, it will not be easily damaged and can be used for a long time.
- Size: The diameter of this globe is approximately 8 inches, which is the optimal size. If the size is too small, it is not easy to display the Earth, and if the size is too large, it is not easy to store or transport.
- Educational Tool: The educational globe has a detailed world map, rich and colorful colors, and clear text to help children understand different countries, continents, capitals, political boundaries, oceans, islands, rivers, and deserts.
- Spinning Earth Globe: The rotating globe is more attractive to your children or students. They can explore different regions through rotation and touch, enhancing their understanding of the Earth and geography.
- World Globe with Stand: This geographic globe has a removable base and frame, which can be used for educational demonstrations and course planning in classrooms, or for office and home decoration.
Why the baseline and units matter
Color alone is not enough to compare maps. The same shade may represent a different rainfall amount, anomaly or probability in different products. NOAA’s Physical Sciences Laboratory (PSL) describes its legacy global ENSO precipitation composites as using GHCN observations from 1857–1994, with monthly anomalies calculated relative to 1951–1980 monthly means and precipitation expressed in millimeters per month. That is a historical dataset and baseline, not a current operational forecast.
For a concise caption, state the season, ENSO phase or event, baseline, data source and period, and whether the map is a historical composite or forecast. Use only details supplied by the map’s own documentation; do not infer a dataset or date from its appearance.
Rank #3
- Package Content:You will receive a geographic world globe with black stand,which measures 6 in/15 cm.The surface of the globe carries detailed geographic information.It includes countries,water bodies,capitals,continental borders,regional borders,and more.
- High-Quality Construction:The educational world globe is made of quality plastic,which will not harm the health of you and your family.It has high quality printing which is fine and clear.It supported with a durable plastic frame and base to ensure stability on a desk or table.
- 360° Rotatable Stand:The decorative rotating world map globe is 360 degree rotating with a premium plastic stand.You can play world travel games with your children,find out different countries by rotating the globe,which can stimulate their enthusiasm for learning.
- Beautiful Decoration:Brightly colored countries sit atop black frames and plinths,adding a dynamic and academic vibe to interiors.It can be used as an exquisite decoration to embellish the living room,bedroom,study room,desk,and office,adding a cultural atmosphere.
- Educational Gift:Our educational globes encourage curious children to explore the world of science.This globe is just the right size,making it a great practical gift for students.It's the perfect gift idea for almost any occasion,such as birthdays,Christmas,new office and studio openings.
What the maps can—and cannot—tell you
Global composites reveal broad-scale patterns, but they may not resolve conditions at a specific island, station or watershed. NOAA CPC publishes separate western tropical Pacific rainfall monitoring material, including station analyses, ENSO composites and rainfall percentile maps. For a local question, a region-specific product is more relevant than treating a global map as a detailed local forecast.
Even a strong El Niño does not make local outcomes certain. Forecast outlooks express probabilities for seasons and areas; they are not guarantees that a location will be wet or dry. And a map of historical averages is not evidence by itself that El Niño caused a particular storm, flood or drought.
Rank #4
- START EXPLORING TODAY — A Must-Have for Any Teacher or Student, Ideal for any Learning Desk, Office, Kids Room, Bookshelf and Classroom
- ADDITIONAL EDUCATIONAL FEATURES — Accurately Tilted Axis, Time Dial, Population Centers, US states separated by different colors, raised relief showing mountain peeks.
- VERIFIED CARTOGRAPHY All Replogle manufactured maps comply with US State Department’s recommended guidelines.
- In order to transform flat map to a spherical shape, there are pre-planned trimming lines on the map that will be shown once globe ball has been formed. These are the trademarks of a traditional globe
- Raised Relief Embossing provides a 3D-like texture that both captivates and educates.
El Niño status is time-sensitive
Forecasts need an issue date because ENSO conditions and outlooks change. NOAA CPC’s diagnostic discussion issued 10 September 2026 described a strengthening El Niño, a greater than 90% chance of a very strong event during Northern Hemisphere fall and winter 2026–27, and a 75% chance during October–December 2026 of a historic event under its stated threshold: a three-month Relative Oceanic Niño Index (RONI) value of +2.5°C or more. Those probabilities belong to that dated discussion and definition; they should not be treated as a current forecast without checking the newest CPC update.
Quick wins for a faster PC:
Clear out junk files and repair common Windows errorsFree Scan →Scan for outdated or missing drivers - takes under a minuteDriver Scan →Repair Windows errors before they cause bigger problemsFix Now →NOAA’s RONI outlook explains that its shaded bands represent forecast ranges for overlapping three-month seasons, with 50%, 70% and 90% probability ranges. The outlook updates monthly alongside the ENSO diagnostic discussion. These forecast ranges describe uncertainty in the index, not a guarantee of rainfall at a particular location.
Quick Recap
Best Value

- Go beyond countries and their capitals using this enhanced globe with a 2.8" video screen that explores cultures, animals, habitats and more through hours of BBC videos
- Educational: This world globe with stand and stylus lets you hear thousands of facts, interact with unique games, and trigger videos to visually experience Earth
- The 2.8" screen displays video and animations with playful characters that guide children through games and activities
- Interactive Map For Kids: Race around the world, discover new places, and solve mysteries by answering quiz questions in three entertaining & interactive games
- Intended for ages 5+ years; requires 4 AA batteries; batteries included for demo purposes only; new batteries recommended for regular use
Sources for interpreting the patterns
- NOAA CPC: ENSO impacts on the United States and surrounding regions summarizes common seasonal rainfall associations.
- NOAA PSL: ENSO precipitation composites describes the legacy global composite, its GHCN data span, anomaly baseline and units.
- NOAA CPC: ENSO Diagnostic Discussion provides dated ENSO status and seasonal probabilities.
- NOAA CPC: RONI outlook graphic explains the outlook’s probability ranges.
- NOAA CPC: Western tropical Pacific rainfall monitoring offers regional monitoring and station-based material.
Product prices and availability are accurate as of the date/time indicated and are subject to change. Any price and availability information displayed on Amazon at the time of purchase will apply.