Applitools reported completing a batch of 100 Storybook visual-test runs in 21 seconds in a 2019 demonstration. The setup covered one Storybook story across 50 viewport sizes and two browsers—Firefox and Google Chrome—using Eyes and Ultrafast Grid. That is a vendor-reported, setup-specific result, not evidence that 100 arbitrary end-to-end UI tests can finish in 20 seconds.
What the 100-test demonstration actually did
In its 2019 demonstration, Applitools described one Storybook story tested across 50 unique viewport sizes in Firefox and Google Chrome. The company said the Eyes Storybook SDK read the stories, ran them through the Storybook engine, generated DOM snapshots and uploaded them. Its server then rendered the snapshots, created or stored visual baselines, analyzed the images and returned results. Applitools reported 21 seconds for that described batch.

As an Amazon Associate I earn from qualifying purchases.
The headline’s “20 seconds” is a rounding of the reported 21-second figure. The result covers the described Storybook visual-testing workflow and its upload and server-side work; it is not an independently reproduced benchmark or a general runtime guarantee.
Outdated Drivers Are Slowing You Down
One free scan finds every outdated or missing driver and matches the right update for your exact hardware.Free scan · exact hardware matchWindows Errors? Fix Them Before They Spread
Repair common Windows errors and clear accumulated junk for a smoother, more stable PC - no reinstall needed.Free scan · no reinstallHow parallel visual rendering reduces the wait
The key distinction is what runs in each environment. In the workflow described by Applitools, the client collects DOM snapshots locally and sends them to Ultrafast Grid. The cloud service launches the requested browser configurations and renders those snapshots in parallel, captures screenshots and sends them for visual analysis. Applitools revisited the approach in a December 6, 2021 post.
#1 Best Overall

- Grafco Ishihara Test Chart Book
- Package Info: Each
- Includes four special plates for tests to determine the kind and degree of defect in color vision.
- Image may not reflect actual product sold. Please read description carefully.
- GHF1254
This differs from replaying every user interaction in a separate end-to-end test on every browser. Snapshot rendering can expand visual coverage without repeating all application interactions in each environment, but it does not replace interaction tests that verify flows such as sign-in, checkout or form submission.
What “100 tests” means—and what it does not
- It means: 100 visual runs of one Storybook story across a configured matrix of browser and viewport combinations.
- It does not mean: 100 independent product workflows, each exercising a different sequence of UI actions.
- It does not establish: a general speedup for any test runner, a controlled comparison with other frameworks, or an independently verified runtime.
When assessing a visual-testing result, check whether the time includes local test execution, snapshot generation and upload, remote rendering, image analysis and result delivery. Also check how many distinct stories or user journeys were tested and which browser/viewport combinations were included.
Rank #2

- individuals with color vision defect should see a different figure from individuals with normal color vision.
- Makes use of the peculiarity that in red-green blindness, blue and yellow appear remarkably bright compared with red and green
- Diagnostic plates: intended to determine the type of color vision defect
- Ishihara Test Chart Books for Color Deficiency 24 Plates with usar manual
How to apply the idea to your own test suite
The demonstration illustrates a design pattern rather than a universal recipe: separate the work that must execute against the application from the rendering work that can be distributed across environments. Before adopting that pattern, decide which assertions need real interaction and which can be evaluated from rendered visual states.
- Choose visual states deliberately. Use component stories or other stable states for appearance checks. Keep interaction tests for behaviors that require user input or navigation.
- Define a useful environment matrix. Select browser and viewport combinations based on your users and supported product requirements; a larger matrix expands coverage but also increases the work being requested.
- Measure each phase. Record local setup and snapshot generation, upload time, remote rendering and analysis, and time to receive results. A single elapsed-time number can conceal where the work occurs.
- Keep test inputs deterministic. Stabilize dynamic content and state where possible so visual differences indicate meaningful changes rather than variable data or timing.
- Validate the result against your own workload. The Applitools figure is a vendor demonstration, so measure your stories, configurations and network conditions rather than assuming the same runtime.
Keep the four-second example separate
The same 2019 Applitools article also reports four seconds for rendering after upload in a smaller example with two browsers and two viewports. That figure describes a different workload and phase; it should not be combined with, or substituted for, the 21-second report for the 100-run batch.
Rank #3

- Vanishing design: Only people with good color vision can see the sign. If you are colorblind you won’t see anything.
- Transformation design: Color blind people will see a different sign than people with no color vision handicap.
- Hidden digit design: Only colorblind people are able to spot the sign. If you have perfect color vision, you won’t be able to see it.
- Classification design: This is used to differentiate between red- and green-blind persons. The vanishing design is used on either side of the plate, one side for deutan defects an the other for protans.
Performance and reliability considerations
- Coverage has a cost. More stories, browser versions or viewports mean more snapshots and rendering configurations. Parallel execution can reduce elapsed time, but the cited result does not establish the cost or capacity limits for another project.
- Remote rendering does not remove local work. The SDK still has to load the Storybook workflow, generate snapshots and upload them before the service can render them.
- Network and setup affect wall-clock time. Upload and result retrieval are part of an end-to-end run, while a rendering-only figure excludes some of that work.
- Visual and functional confidence are different. A screenshot comparison can catch presentation changes, but does not by itself prove that controls, routes or backend-dependent flows work correctly.
- Evidence is vendor-reported. The cited account is Applitools’ own demonstration; the cited sources do not provide an independent replication or a neutral comparison.
Troubleshooting slow or misleading visual runs
Runs take much longer than the reported example
Do not treat 21 seconds as a target until the workload matches. Compare story count, viewport/browser matrix, snapshot generation and upload time, then separate remote rendering and analysis from local work. The demonstration’s 100 runs refer to one story over a specific matrix.
Snapshots differ from run to run
Investigate changing data, animations, delayed content and other state that can alter the rendered page. Make the story’s inputs and capture timing stable, then rerun to determine whether the difference is repeatable.
Rank #4
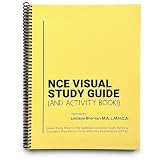
- This illustrated & interactive study guide for the National Counselor Exam (NCE) uses images, colors, mnemonics, and humor to engage brains in effective study.
- 150+ page activity book including coloring book pages, fill in the blank sheets, and tear-out flashcards with content addressing all domains covered in the NCE + CPCE counselor exams.
- Full size 8.5x11, spiral-bound for lie-flat studying.
- Printed on premium, 80lb textured paper you can color and highlight with no bleed.
- Drawn by (human!) hand. Printed and bound in the USA.
A visual test passes but a user flow is broken
Add or retain interaction-level tests for the behavior in question. Snapshot rendering evaluates visual states; it is not equivalent to replaying every user action through the product.
The headline runtime cannot be reproduced
First confirm which phases your timer includes and whether your test set and environment matrix match the described demonstration. Applitools’ published figure is vendor-reported and setup-specific, so a different runtime does not by itself indicate a fault.
Independent reader supportYour contribution helps us test, update, and keep practical guides available for everyone.Or skip the browser setup
If your immediate need is to capture a webpage rather than run Storybook visual tests, ScreenshotNeo provides a screenshot API and MCP server. One GET request can return a PNG, JPEG, WebP or PDF. For example, using the API key and target URL:
curl -G "https://api.screenshotneo.com/v1/shot" -d access_key=YOUR_API_KEY --data-urlencode url=https://stripe.com -o shot.webpSee the ScreenshotNeo API documentation for request options. Cookie banners, newsletter popups and chat widgets are removed before capture; bot checks, blank pages and failed loads are never billed. Its MCP server lets AI agents take screenshots. The free plan includes 1,000 screenshots a month with no card, and paid plans start at $5 for 3,000.
Sign up for ScreenshotNeo free to get 1,000 screenshots a month with no card.
Recommended Free Tools
Quick Recap
Product prices and availability are accurate as of the date/time indicated and are subject to change. Any price and availability information displayed on Amazon at the time of purchase will apply.




