AI road-condition surveys combine cameras or 3D sensors, location equipment and image-processing software to turn pavement observations into mapped records of defects. Cameras can reveal visible cracks and potholes; stereo imaging and laser profiling add surface geometry that can support depth estimates. The resulting data helps road managers decide where to investigate and plan maintenance, but a detection is not an engineering diagnosis. Image quality, calibration, false positives and quality checks all affect how much confidence a survey deserves.
What a road-condition survey actually measures
A survey vehicle collects observations as it travels along the road. The simplest systems capture two-dimensional (2D) images or video of the pavement. More elaborate systems add measurements of surface shape and texture, or reconstruct a three-dimensional (3D) surface from stereo images or laser scans. Positioning and distance-measurement equipment associate the observations with locations along the route.
As an Amazon Associate I earn from qualifying purchases.
These are complementary measurements, not different names for the same thing. An image records how the surface looks; a 3D sensor adds information about its geometry. That distinction matters when a road authority needs to map visible distress versus estimate how a defect is shaped or how far it extends below the surrounding surface.
Do these 3 things before closing this tab:
1Repair Windows errors before they cause bigger problems2Fix the driver behind crashes, sound loss and screen glitches3Clear out junk files and repair common Windows errors| Survey method | What it captures | Useful for | Important limit |
|---|---|---|---|
| Area camera images or video | Visible pavement appearance | Locating and mapping visible cracks and other surface features | A flat image does not directly establish depth, and visibility depends on image quality and conditions. |
| Line-scan camera | Continuous transverse strips of pavement imagery | Covering pavement at a selected sampling resolution across and along the direction of travel | Along-road sampling depends on scan rate and vehicle speed. |
| Stereo cameras | Two images with overlapping views | Reconstructing surface geometry by matching common points in the views | Geometry depends on calibrated camera arrangement and successful image matching. |
| Laser profiling or scanning | Laser measurements of surface shape; in line profiling, the projected line’s deformation | Building a 3D surface model that can support crack geometry and depth estimates | It requires calibrated system geometry and is a specialist survey setup. |
The Federal Highway Administration’s overview of 2D and 3D imaging describes vehicle-mounted digital cameras, line scanning, stereo vision and laser profiling. A line-scan camera’s transverse resolution depends on its pixel count; its longitudinal resolution depends on vehicle speed and scan rate. An encoder can feed vehicle-speed information to adjust the scan rate and preserve uniform sampling as speed changes.
#1 Best Overall

- UPSCALED 4K FRONT + 1080P REAR DUAL DASH CAM: The ROVE R2-4K DUAL records the road ahead and behind at the same time. The front camera captures at 2.5K (QHD) and intelligently upscales to 4K (2160P) for higher-detail playback, while the rear camera records at Full HD 1080P. This is upscaled 4K, not native 4K, engineered to show sharper everyday detail than standard 1080P dash cams, so you can read license plates, signs, and surroundings in front and rear footage.
- SONY STARVIS 2 IMX675 SENSOR + SUPER NIGHT VISION: The front camera uses a Sony STARVIS 2 IMX675 5MP image sensor with a wide F1.5 aperture (F1.8 rear) and HDR to pull in more light for clearer low-light footage. This advanced sensor enhances nighttime clarity, helping capture license plates, road signs, and surrounding vehicles with greater reliability when driving after dark, through tunnels, or in dusk and dawn conditions.
- ULTRA FAST 5.8GHz WIFI/ UP TO 20MB/s DOWNLOAD SPEED: With its built-in dual-band 5.8GHz and 2.4GHz WiFi, you can use the ROVE dash cam app to view and manage dash cam recordings instantly on your iPhone and Android smartphone. Using the ROVE app, download your recorded videos directly to your smartphone at up to 20 MB/sec, then easily share them on social media with friends and family. Additionally, manage camera settings and update the latest firmware over-the-air via the ROVE App.
- CAR CAMERA WITH GPS: The new front and rear dashcam comes with built-in GPS, which enables you to view real-time live speed and compass on the 3” IPS wide camera screen. It records precise driving routes, locations, and speed stamps directly on the video so you can watch dashcam videos with GPS data using ROVE's free GPS Player on your PC or Mac & get additional evidence when you need it.
- FEATURES WITH STATE-OF-THE-ART TECHNOLOGY INCLUDED: Experience peace of mind with this front and rear car dash cam. It comes with a free 128GB microSD card and offers advanced features such as an f1.5 aperture, motion detection, G-sensor, seamless loop recording, emergency video lock, screen saver, live speed and compass direction, voice guidance, ring of threads for optional CPL filter, a built-in supercapacitor for extended product life, support for up to 1TB microSD cards, and many more.
How software turns images into crack and pothole records
Automated detection begins with sensor data, not with an AI decision in isolation. Software processes images to identify patterns associated with pavement distress. In crack mapping, a common visual cue is that cracks look darker than intact pavement. An algorithm can locate those candidate dark lines and convert them into mapped features, but the cue is only useful when the crack is visible against the pavement.
In England, the Department for Transport describes TRACS and SCANNER survey vehicles that continuously collect downward-facing road imagery and process it with automatic crack-detection software. A crack map can record each detected crack’s transverse and longitudinal position, length and angle relative to the direction of travel. Other survey measurements can be reported by road segment and combined with location and road-geometry data. The mapped results can help identify lengths for further investigation and inform maintenance scheme prioritisation and design.
AI is one way to recognize patterns in the imagery. The FHWA Federal Lands report describes machine learning as training computer systems to identify features in images. That does not mean every system uses the same model, sensor setup or processing workflow. A road survey also depends on data capture, calibration, mapping and quality control. A model can flag a likely defect; the larger system must preserve where it occurred and whether the observation is reliable enough to use.
Free tools Windows power users keep installed
One-click scans. No signup required.
What 3D sensors add—and what their figures mean
A 2D image can show a crack’s visible trace, but generally cannot directly establish its depth. Stereo cameras add a second viewpoint: software matches points appearing in both images and uses the camera geometry to reconstruct the surface. A laser profiler projects a line onto the pavement and reconstructs 3D points from how the line deforms, using calibrated system geometry. Those surface models can support estimates of crack geometry and depth that a flat image alone cannot provide.
FHWA reports an example of systems collecting 2D and 3D data at 60 mph (about 96 km/h), with 0.3 mm depth resolution and 1.0 mm lateral resolution. Those numbers are a reported capability example from the FHWA page, not a general specification for road surveys or a promise about current systems. A separate FHWA Federal Lands report summarizes a particular UAS-based study by Zhang and colleagues, reporting 0.5 cm 3D reconstruction accuracy for that method; it should likewise be read as a study-specific result, not as a universal accuracy figure.
Rank #2

- [4K+1080P Dual Recording] REDTIGER F7N TOUCH captures your drive journey in stunning 4K UHD resolution with STARVIS 2 sensor 170° wide-angle view for the front dash cam and 1080P FHD resolution 140° wide-angle for the rear car camera. Equipped with WDR and HDR technology, the enhanced super night vision ensures better visibility even in low-light situations, providing you with reliable recordings day and night.
- [Voice Control & Touch Screen] F7NTOUCH dashcam features voice commands, allowing for hands-free control of your 4K car camera, which enhances safety by minimizing distractions. The dual camera dash cam also has smart touchscreen that can lock emergency video, turn on wifi, and capture scenery with one click. Redtiger also retains the buttons, multiple control methods are integrated.
- [Built-in GPS & 5.8GHz WiFi] Both Android and IOS users can connect to dashcam WiFi via the REDTIGER Cam app. Although the dash cam is installed wired, you can enjoy wireless control on your smartphone, faster 20MB/s download speed and share your driving experiences in real-time with friends and insurance companies. Car recorder built-in GPS provides traceable location, speed, and accurate route in the recordings.
- [Loop Recording & G-Sensor] REDTIGER F7N TOUCH dual channel dash cam automatically overwrites the oldest footage when the memory is full, ensuring endless recording with the included 128GB card. With a built-in G-sensor that detects sudden movements or impacts, it automatically locks and protects the associated footage when an event is detected on the road, ensuring it won't be overwritten during loop recording.
- [24-hour Parking Monitoring*] REDTIGER Car dashboard camera offers G-Sensor Parking Mode that automatically record when it detects any collisions or sudden motion while vehicles is parked. Time Lapse Parking Mode provides continuous surveillance by offering a condensed overview of any events that may occur during parking periods. *Please note that the parking monitoring function requires a separate hardwire kit.
Laser 3D imaging can be less sensitive during data collection to lighting effects, stains and weak contrast between a crack and the surrounding pavement than ordinary image-based crack mapping. That advantage does not remove the need for calibration or review: 3D measurements still depend on the sensor system and the quality of the collected data.
How a defect becomes a usable road-location record
A list of detected defects without reliable locations is difficult to act on. Survey systems therefore join the observations to position and distance measurements so that road managers can associate them with a particular carriageway and stretch of road. The English TRACS example combines laser-based surface-shape and texture measurement, downward-facing video for cracking, forward-facing video, inertially assisted differential GPS and distance measurement for location reference.
The processing workflow can then preserve both the feature and its context: where it lies across and along the road, its measured attributes, the road segment it belongs to, and any linked geometry or condition observations. This makes records useful for comparing lengths of road and directing follow-up work, rather than leaving staff with an unlocated image or an isolated model label.
Mobile LiDAR systems can include scanners, GNSS receivers, inertial measurement units, cameras and ancillary equipment. FHWA’s summary of NCHRP Report 748 notes that asset attributes may still need to be applied to LiDAR datasets manually or semi-automatically. The report was published in 2013, so it is useful for understanding system components and planning considerations, not for establishing what a particular product currently offers.
Where detection can fail or mislead
Image contrast and visibility
Crack detection based on dark appearance can miss or misclassify features when resolution or contrast is poor, when a crack is difficult to distinguish on a particular pavement, or when shadows, lighting or stains interfere. These are not merely theoretical concerns: the visual cue that helps software find a crack can also be obscured by the scene. A flagged line should therefore be treated as evidence to assess, not as proof that the software has interpreted the surface correctly.
Rank #3

- [4K+1080P Front & Rear Recording] REDTIGER F7NP dash cam captures every detail with stunning 4K front and 1080P rear video. Featuring the advanced STARVIS 2 sensor plus the 170° front and 140° rear wide-angle lens, this dash camera delivers sharper images, balanced lighting, and reliable evidence day or night. Ideal for commuting, road trips, rideshare drivers, and new drivers.
- [STARVIS 2 Sensor & WDR Night Vision] Equipped with the advanced STARVIS 2 sensor, F1.5 large aperture, and 6-layer optical lens, F7NP 4K dual dash cam delivers clear, high-contrast footage in any lighting. WDR and HDR technology balance highlights and shadows, ensuring sharp night vision and crisp details day or night, providing reliable evidence and enhanced safety for every drive.
- [Built-in 5.8GHz WiFi & Smart App] Connect your smartphone to the dashcam’s built-in 5.8GHz WiFi to enjoy ultra-fast downloads up to 20MB/s. Using Redtiger Cam app, you can preview, download, and replay videos in real time, check GPS ata (route, speed, and location), and manage settings effortlessly, making it simple to review footage and share important moments.
- [Loop Recording & Free Memory Card] This car camera supports seamless loop recording to ensure continuous coverage without interruption. Older files are automatically overwritten when storage is full, while important events are safely locked. A free memory card is included, giving you ample space for 4K recordings and allowing you to use the camera right out of the box.
- [24/7 Parking Mode* & G-Sensor] Enjoy round-the-clock protection with two parking modes: time-lapse recording for continuous low-bitrate monitoring and G-sensor mode that records when collision is detected. The car security camera with G-sensor automatically locks important clips, ensuring crucial evidence is safely preserved even while your vehicle is parked.(*Hardwire kit needed.)
False positives and processing limits
The FHWA Federal Lands report discusses a specific UAS prototype tested by Petkova in 2016. Its video ran at 24 frames per second, but analysis used one frame per second at 1080-pixel resolution; the UAS flew at 3–4 metres altitude and 1 metre per second. In those tests, the prototype was most useful for potholes, produced a high false-positive rate for distress other than potholes, and its onboard computer could not process pothole classifications fast enough for reliable real-time deployment. Those findings describe that prototype and test, not AI road surveys as a whole.
The example illustrates why detection accuracy and operational readiness are separate questions. A system might identify a useful class of defects in captured imagery but still produce too many incorrect flags for other classes, or process data too slowly for the intended field workflow. Performance should be assessed for the defect types, collection conditions and operating setup that matter to the survey.
Detection is not diagnosis
A mapped crack or pothole is a condition observation. The cited survey guidance uses these records to identify road lengths for investigation and support maintenance planning; it does not establish that an automated detection alone determines the defect’s structural cause, repair urgency or engineering remedy. Those decisions require appropriate inspection and assessment beyond the model’s label.
Independent reader supportYour contribution helps us test, update, and keep practical guides available for everyone.How quality assurance makes survey data more trustworthy
Survey quality depends on more than the algorithm. Equipment must be calibrated, the vehicle must collect comparable data, and results need checks that can reveal inconsistent or incorrect measurements. In England, the Department for Transport describes an assurance process for TRACS that includes vehicle accreditation before surveys, re-accreditation every three months, repeat surveys, independent audit and comparisons at randomly selected sites with an independent survey vehicle.
Those procedures are an England-specific example, not a universal rule for every road authority. Their practical lesson is that a survey programme should be judged not only by the defects it reports, but also by how it establishes repeatability and checks its results. For a reader reviewing a survey report, useful questions include:
Quick wins for a faster PC:
Fix the driver behind crashes, sound loss and screen glitchesFind Drivers →Clear out junk files and repair common Windows errorsFree Scan →Rank #4
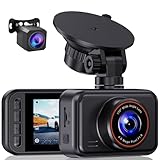
- 2.5K Front + 1080P Rear Recording: S60 records 25601440P front video and 1080P rear video to help capture what happens ahead of and behind your car. The front 170 wide-angle lens helps cover more of the road during daily drives or unexpected events
- WDR Night Vision: The starlight night vision sensor and 6-layer glass lens help improve video clarity in low-light conditions. WDR helps balance bright headlights and darker areas, making footage easier to review at night, in tunnels, parking lots, and other changing light conditions
- Loop Recording & G-Sensor Lock: Loop recording replaces older unprotected clips when the card is full. SD card is not included, and the dash cam supports cards up to 256GB. If a sudden impact, hard braking, or collision is detected, the G-sensor locks the current clip to help protect important footage
- Optional 24-Hour Parking Monitor: S60 supports a 24-hour parking monitor with time-lapse recording. This feature requires a compatible Type-C hardwire kit, not included
- 2" IPS Screen & 360 Suction Mount: The 2" IPS screen lets you check the camera view and adjust basic settings directly on the device. The 360 suction mount makes it easier to adjust the camera angle and remove or reinstall the unit
- Which sensors captured the road, and was the output based on 2D appearance, 3D geometry or both?
- How were observations tied to road location, and what attributes are included in the delivered records?
- What calibration, accreditation, repeat-survey or independent-check procedures apply?
- For which defect classes and operating conditions has the detection workflow been evaluated?
- Are automated detections reviewed or otherwise checked before they are used to prioritise investigation or maintenance?
Choosing a survey approach for the job
The appropriate setup depends on the question the road authority needs answered. If the task is to map visible cracking across a network, a camera workflow may provide the needed imagery and crack attributes. If surface geometry or depth-related estimates matter, stereo or laser measurement adds information unavailable in a flat image. If the programme needs network-scale records, location reference and consistent deliverables matter as much as the detector itself.
| Need | What to look for | Trade-off or qualification |
|---|---|---|
| Visible crack mapping | Downward-facing imagery, automated processing and records of crack position, length and orientation | Results depend on visibility, contrast, lighting and image quality. |
| Surface geometry or depth-related estimates | Stereo reconstruction or laser profiling with calibrated geometry | 3D output adds measurement capability but does not itself diagnose structural cause. |
| Consistent sampling at vehicle speed | A scan design that relates longitudinal sampling to speed, potentially using an encoder to adjust scan rate | Sampling behaviour depends on the chosen sensor and system configuration. |
| Road-network asset records | Positioning and distance reference, segment-level reporting and defined output attributes | Some asset attributes may require manual or semi-automatic work after LiDAR collection. |
| Inspection of selected locations with a UAS | Evidence that the platform can detect the relevant defect classes and process data at the required rate | A 2016 prototype described by FHWA had false-positive and real-time processing limitations; do not generalise its result to other UAS systems. |
For pavement-management planning, the key question is not simply whether software uses AI. Ask whether its measurements, location references, defect categories and checks match the decisions the authority needs to make. An image-only workflow can be adequate for visible features, while requests for geometric measurements call for sensors that collect 3D information.
What England’s current guidance says about survey programmes
The Department for Transport’s guidance updated 21 January 2026 describes TRACS surveys on England’s trunk roads and SCANNER surveys for the classified road network. It says TRACS has operated since 2000 and that surveys have been annual across mainline carriageway lanes since 2017. These programme details describe England and should not be read as requirements for other countries or road networks.
The same guidance says PAS 2161 was published in September 2024 and that the Department for Transport, BSI, TRL and industry are implementing it, with exercises intended to demonstrate data comparability, accuracy and quality. For readers comparing condition data, that work highlights a broader issue: results from different survey systems are only useful together when their measurements and quality are sufficiently comparable.
What’s actually slowing this PC down?
Pick the symptom - the matching free tool is one click away.
Sources: FHWA, “Pavements – 2D and 3D Imaging Technology”; Department for Transport, “Section 2: measuring surface condition using automated visual methods”; FHWA Federal Lands Management Agency, “UAS FLMA Road Inspections Report” (2025); FHWA summary of NCHRP Report 748 (2013).
Quick Recap
Product prices and availability are accurate as of the date/time indicated and are subject to change. Any price and availability information displayed on Amazon at the time of purchase will apply.




