What’s actually slowing this PC down?
Pick the symptom - the matching free tool is one click away.
For most teams with low, bursty, or uncertain demand, a metered cloud AI API is cheaper overall. You avoid buying GPUs, installing a server, hiring operations staff, and paying for idle capacity. Self-hosting open-weight models can become less expensive when traffic is sustained and high enough to keep accelerators busy for months. Renting GPUs is the middle option: it can lower marginal inference cost without committing to hardware ownership.
The right answer depends on total cost of ownership (TCO), not on whether model weights are free. Compare token charges after caching, batching, residency and commitment modifiers with GPU purchase or rental, installation, power, networking, storage, support, depreciation, orchestration, security and utilization. The calculations below show how to do that with your own workload.
| # | Preview | Product | Price | |
|---|---|---|---|---|
| 1 |

|
NVIDIA Tesla L4 24GB PCIe Graphics ACELLERATOR HH/HL 75W GPU 900-2G193-0000-000 | $3,950.00 | Buy on Amazon |
| 2 |

|
NVIDIA L4 | $4,187.00 | Buy on Amazon |
| 3 |
|
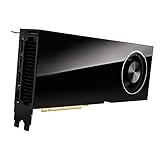
PNY VCNRTXA6000-PB NVIDIA 48GB GDDR6 Graphics Card | $6,167.99 | Buy on Amazon |
| 4 |
|
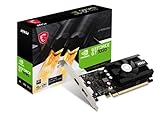
msi Gaming GeForce GT 1030 4GB DDR4 64-bit HDCP Support DirectX 12 DP/HDMI Single Fan OC Graphics... | $119.97 | Buy on Amazon |
| 5 |

|
VIPERA NVIDIA GeForce RTX 4090 Founders Edition Graphic Card | $4,699.95 | Buy on Amazon |
As an Amazon Associate I earn from qualifying purchases.
The short answer
- Choose a cloud API when monthly volume is below roughly 100 million tokens, demand is spiky, latency and quality requirements change often, or you do not have people to run inference infrastructure.
- Consider renting GPUs when traffic is high and steady but you want to avoid server depreciation, procurement and hardware outages.
- Consider buying and self-hosting when throughput is predictable, accelerators can run at high productive utilization, a suitable open-weight model meets your quality target, and data-control or offline requirements have value.
The OECD’s 2026 modeled scenarios state that the economic benefits of self-hosting are not evident for workloads below 100 million tokens per month and that self-hosting becomes cost-effective only at scale. Those are modeled results, not a universal threshold: model size, quantization, serving software, region, utilization and current prices can move the crossover point substantially.
What you are really comparing
An API bill is visible because the provider charges per input and output token. A private deployment spreads costs across several categories, some of which are easy to miss. Use the following as the complete comparison rather than treating GPU purchase price as the self-hosting cost.
#1 Best Overall
- 24GB Video Memory
- Fourth Generation Tensor Cores
- HALF HEIGHT BRACKET ONLY
| Cost or decision factor | Cloud API | Self-hosted or rented GPU |
|---|---|---|
| Inference | Input and output token rates, with cache, batch, regional and commitment modifiers | Hardware or hourly rental cost divided by productive tokens |
| Fixed infrastructure | Usually included in the provider’s service | GPU, server chassis, memory, storage, networking and installation |
| Operations | Provider manages serving, capacity and hardware; you still pay integration and monitoring time | Engineering, on-call support, upgrades, orchestration, observability, security and incident response |
| Utilization risk | You pay for actual tokens; idle capacity is the provider’s problem | You pay for reserved or owned capacity even when traffic is low |
| Performance | Published model quality, context and latency, subject to provider limits | Depends on model, quantization, memory, batching, serving stack and GPU availability |
| Control | Provider controls execution environment and may offer residency options | Greater control over data location, model weights, network isolation and offline operation |
Include taxes, insurance, colocation, electricity, cooling and financing where they apply. Include staff time at a loaded cost, not just the salary of a person who happens to own the project. If a deployment requires a second engineer for on-call coverage, that recurring cost can outweigh a large fraction of the GPU bill.
Measure the workload before looking at prices
Export at least 30 days of production or pilot traffic. A monthly token total alone is not enough to size a system or predict its cost.
Recommended Free Tools
- Separate input and output tokens. Record monthly totals and the distribution per request. Output-heavy workloads can cost much more than input-heavy workloads at the same total token count.
- Measure concurrency. Capture average and peak simultaneous requests, requests per second and the peak-to-average ratio. A system sized for the peak may be mostly idle if bursts are short.
- Set a latency target. Distinguish time to first token from total completion time. Streaming responses can make a high-throughput system feel fast while still consuming substantial GPU time.
- Record context length. Long prompts consume memory and reduce throughput. Include retrieval passages, tool traces, conversation history and system prompts, not only the user’s message.
- Estimate cache and batch eligibility. Identify repeated prefixes and whether requests can wait for asynchronous processing. These features materially change API economics.
- Model growth and seasonality. Prepare at least flat, moderate-growth and rapid-growth cases. A deployment that is cheapest at today’s volume may be the wrong choice if demand doubles before hardware is paid off.
Use measured values in a spreadsheet with one row per model and deployment option. Keep peak capacity and monthly token economics separate: the former determines how many GPUs you need, while the latter determines how quickly those GPUs amortize.
How cloud API pricing changes the result
Input, output and cached tokens
Providers publish model-specific input, cached-input and output rates. Do not multiply a blended token count by one headline number. Calculate (input tokens × input rate) + (output tokens × output rate), then apply cache and other modifiers to the eligible portion.
Anthropic’s current pricing documentation says its Batch API discounts both input and output tokens by 50%. The same documentation prices cache reads at 0.1 times the standard input rate in the general case. For a US-only inference setting on Claude 4.6 and later, it specifies a 1.1 times multiplier. A workload with a high repeated-prefix rate can therefore have a very different effective price from a workload with unique prompts, even when total tokens match.
OpenAI’s current pricing documentation lists model-specific input, cached-input and output prices and states that eligible regional-processing endpoints receive a 10% uplift. Treat residency as a line item rather than assuming that a compliance setting has no economic effect.
Batching and commitments
Batch processing is useful for embeddings, evaluations, back-office extraction and other work that does not need an immediate response. Compare the lower batch rate with the business cost of waiting for completion and with any limits on request size or retention. For interactive traffic, a committed-use discount may reduce the unit price but increases the risk of paying for capacity you do not use.
A representative scale example
In an OECD 2026 representative Gemini 3.1 pay-as-you-go scenario, 1 billion tokens per month costs USD 8,000. This is a scenario estimate, not a universal API price, and it does not substitute for the current table of the model and region you plan to use. At that rate, annual API spend would be USD 96,000 before any batching, caching, commitment discount or additional service charges.
What self-hosting really costs
Hardware and installation
The OECD’s 2026 modeled private-hosting cases list the following one-time GPU and installation amounts:
Rank #2
- 900-2G193-0000-000
| Modeled case | GPU cost | Installation cost | Combined initial outlay |
|---|---|---|---|
| Small | USD 8,000 | USD 7,500 | USD 15,500 |
| Medium | USD 30,000 | USD 15,000 | USD 45,000 |
| Large | USD 75,000 | USD 37,500 | USD 112,500 |
| Very large | USD 240,000 | USD 120,000 | USD 360,000 |
These figures are modeled scenarios, not current retail quotations. A deployable server may require multiple GPUs, a motherboard and chassis that support them, high-capacity RAM, local NVMe storage, power distribution, cooling, network interfaces and a spare-parts plan. Confirm current hardware and rental rates for your region before making a purchase decision.
The Tool Desk
Outbyte Driver Updater FREEScan for outdated or missing drivers - takes under a minuteDriver Scan →Outbyte PC Repair FREERepair Windows errors before they cause bigger problemsFix Now →Recurring operating costs
- Electricity and cooling: calculate GPU, host and cooling draw at the expected duty cycle, not the nameplate maximum alone.
- Colocation or data-center fees: rack space, power allocation, cross-connects and remote-hands support can exceed household electricity rates.
- Storage and networking: model weights, container images, logs, datasets, backups and egress all consume capacity.
- Software and orchestration: serving software, schedulers, autoscaling, queueing, observability and secrets management need maintenance.
- People and support: budget for deployment, driver and CUDA upgrades, model rollbacks, incident response, security patches and capacity planning.
- Depreciation and failure: GPUs lose economic value as faster generations arrive. Include warranty gaps, replacement hardware and downtime.
Divide this full cost by productive tokens, meaning tokens delivered at your latency and reliability target. Theoretical benchmark throughput is not a cost input if memory pressure, queueing or tail latency prevents you from achieving it in production.
GPU capacity and model fit
The OECD’s representative mapping gives a sense of scale: under 100 million monthly tokens corresponds to one L4; 1 billion to one H100; 10 billion to two or three H100s; and 50 billion to eight H100s. These are representative mappings, not sizing guarantees. A larger model, longer context, higher concurrency or less aggressive quantization can require more memory and GPUs; a smaller model or efficient batching can require less.
Before buying hardware, verify that the chosen model fits in GPU memory with its inference precision, key-value cache and safety margin. Then test the serving stack at the required concurrent load. A model that fits for a single request can run out of memory when several long contexts arrive together.
When the OECD scenarios reach break-even
The OECD 2026 model reports the following time to recover private-hosting costs relative to its cloud baseline:
Windows Errors? Fix Them Before They Spread
Repair common Windows errors and clear accumulated junk for a smoother, more stable PC - no reinstall needed.Free scan · no reinstallCrashes, No Sound, or Screen Glitches?
Random freezes, missing sound and display glitches usually trace back to one bad driver. Find and replace yours safely.Free scan · under a minute| Modeled workload | Break-even timing | Interpretation |
|---|---|---|
| Small | No break-even | Modeled savings never recover the initial and operating costs |
| Medium | 30.4 months | Requires a long, stable demand horizon |
| Large | 1.8 months | High utilization makes the modeled capital outlay recover quickly |
| Very large | 1.0 month | Scale dominates the modeled economics |
The table should be read as a sensitivity warning, not as a promise. A small change in utilization, GPU price, model efficiency or API pricing can move a crossover by many months. The medium case in particular is vulnerable to demand volatility because a long payback period leaves more time for prices and models to change.
GPU rental as the middle path
Renting removes the largest ownership commitments while preserving more control over the serving stack than a token API. You can scale down when demand falls, test several model sizes and avoid tying up capital in a server that may be obsolete before it is fully depreciated. The trade-off is exposure to hourly price changes, regional capacity shortages, egress charges and the operator’s hardware reliability.
One OECD example prices eight H100 GPUs rented continuously at USD 5 per hour at approximately USD 350,000 per year. The same scenario estimates USD 4.8 million per year for pay-as-you-go API use. The rental figure excludes transfer, storage, orchestration and managed-service charges, so it is not an all-in comparison. It does demonstrate why sustained, high-volume inference can favor rental even when buying hardware is undesirable.
For a rental estimate, multiply hourly GPU price by the number of GPUs and the hours actually reserved, then add host fees, storage, data transfer, orchestration, support and idle time. Compare that total with the API cost for the same input/output mix and latency target. A rented cluster that runs only during a short daily peak may be cheaper than owning, while a continuously busy cluster may justify ownership after depreciation and maintenance are included.
Rank #3
- Memory: 48GB, GDDR6
- PCI Express x16 4.0 interface
- Maximum resolution: 7680 x 4320 pixels
- Ports: 4 x DisplayPorts
- Backed by a 3 years manufacturers warranty
Calculate your own break-even point
Use a monthly model with separate rows for API, rental and ownership. The core calculation is:
monthly API cost = (input tokens × effective input rate) + (output tokens × effective output rate) + fixed service charges
monthly self-hosting cost = (capital outlay ÷ useful-life months) + power + facility + storage/network + software + support + engineering + outage allowance
break-even months = initial outlay ÷ (monthly API cost − monthly self-hosting operating cost)
Free tools Windows power users keep installed
One-click scans. No signup required.
Only use the break-even formula when the denominator is positive and demand is expected to remain stable. If self-hosting operating cost is already higher than the API bill, there is no break-even at that utilization. For a realistic range, calculate the result at 20%, 50% and 80% productive utilization. Also run a demand-growth case; growth can shorten payback, while a sustained decline can eliminate it.
Illustrative use of the OECD 1-billion-token scenario
Suppose your workload resembles the OECD representative case of 1 billion tokens per month and its USD 8,000 monthly API estimate. Do not assume that an H100 automatically costs less: you must add the server, installation, power, support and depreciation, then determine how many productive tokens it delivers. If your measured utilization is low because requests arrive in bursts, the GPU’s monthly fixed cost is spread over fewer tokens and the API may remain cheaper. If the GPU serves a steady queue near its tested throughput, the same hardware can amortize faster. The OECD’s 30.4-month medium-case result shows how long payback can remain even at a substantial workload under its assumptions.
Demand shape is often more important than token volume
Steady traffic
Steady, round-the-clock traffic keeps GPUs busy and makes fixed costs predictable. This is the strongest case for owned or rented inference, provided the model meets quality and latency requirements.
Spiky traffic
Short peaks separated by idle periods are expensive to serve with owned hardware. An API absorbs the peak without requiring you to reserve enough GPUs for the maximum. A hybrid design can keep a small private capacity for sensitive or latency-critical requests and burst overflow to an API or rental pool.
Quick wins for a faster PC:
Clear out junk files and repair common Windows errorsFree Scan →Scan for outdated or missing drivers - takes under a minuteDriver Scan →Repair Windows errors before they cause bigger problemsFix Now →Uncertain or seasonal traffic
When a product is new, demand forecasts are unreliable. Preserve optionality: start with an API, instrument tokens and latency, then revisit rental or ownership after several months of measured demand. A lower theoretical unit price is not valuable if a hardware purchase becomes stranded.
Rank #4
- Chipset: NVIDIA GeForce GT 1030
- Video Memory: 4GB DDR4
- Boost Clock: 1430 MHz
- Memory Interface: 64-bit
- Output: DisplayPort x 1 (v1.4a) / HDMI 2.0b x 1
Performance, quality and operational trade-offs
Cost per token is meaningful only if the model solves the task. Compare answer quality, tool use, structured-output reliability, context length, throughput, tail latency and safety behavior. A cheaper open-weight model may require retries, larger prompts, a second verification model or human review, erasing the apparent savings.
Self-hosting gives you control over quantization, fine-tuning, batching and routing among models. It also makes you responsible for regressions, prompt-injection defenses, abuse controls, model-license compliance and patching the serving environment. Cloud providers generally offer managed rate limiting, authentication, telemetry and versioned endpoints, but you must evaluate their retention, residency and outage policies for your jurisdiction and data class.
Do these 3 things before closing this tab:
1Repair Windows errors before they cause bigger problems2Scan for outdated or missing drivers - takes under a minute3Clear out junk files and repair common Windows errorsControl and compliance requirements
Choose private infrastructure when a requirement genuinely cannot be met by an API contract or regional endpoint: offline operation, an isolated network, specific data-residency controls, custom weights, or a prohibition on sending prompts to an external processor. Document the requirement and its monetary value. If regional processing is sufficient, include the provider’s stated premium rather than assuming that a private cluster is automatically cheaper.
For every option, ask where prompts, outputs, logs, backups and support-access records are stored; how deletion is verified; who can administer the GPUs; and how incidents are reported. These controls create engineering and audit work in a private deployment even when the model weights themselves have no license fee.
Common failure modes and fixes
Comparing an API token price with a GPU sticker price
Problem: The calculation omits installation, server components, power, staff and depreciation.
Fix: Use the full TCO categories above and include a separate line for idle capacity.
Using theoretical GPU throughput
Problem: A benchmark assumes short prompts, maximum batching and no tail-latency requirement.
Fix: Benchmark your model, context distribution and concurrency at the service-level objective you must meet. Use delivered tokens, not peak tokens per second.
Ignoring provider modifiers
Problem: The estimate misses cache reads, batch discounts, regional-processing uplifts or committed-use terms.
Best Value
- 16,384 NVIDIA CUDA Cores
- Supports 4K 120Hz HDR, 8K 60Hz HDR and variable refresh rate as indicated in HDMI 2.1A
- New streaming multiprocessors: up to 2x power and power efficiency
- Fourth generation tensor cores: up to 2x AI power
- Third-generation RT cores: up to 2x ray tracing performance
Fix: Apply each modifier to the eligible token subset and document the assumption and date of the price table.
Buying for the peak
Problem: Hardware sits idle outside a short daily or seasonal peak.
Fix: Compare an API or rental burst strategy, queue non-urgent jobs for batch processing and reserve private capacity only for the portion that needs it.
Underestimating operations
Problem: No owner is assigned for drivers, model upgrades, security patches, backups or incidents.
Fix: Put named engineering hours and on-call coverage in the TCO model before approving hardware.
Windows Errors? Fix Them Before They Spread
Repair common Windows errors and clear accumulated junk for a smoother, more stable PC - no reinstall needed.Free scan · no reinstallCrashes, No Sound, or Screen Glitches?
Random freezes, missing sound and display glitches usually trace back to one bad driver. Find and replace yours safely.Free scan · under a minuteTreating open source as zero cost
Problem: Free or open-weight access is mistaken for free inference.
Fix: Price serving, electricity, hardware, support, reliability and compliance. Verify the model’s license permits your intended use.
A practical decision framework
- Start with an API baseline. Price at least two suitable cloud models using current input, cached-input and output tables. Include batch eligibility, cache hit rate, residency premium and any commitment.
- Build a production traffic profile. Use measured tokens, concurrency, context length, peak-to-average ratio and latency targets.
- Size a private deployment. Test the smallest model and GPU combination that meets quality and memory requirements, including safety margin for concurrent requests.
- Add complete TCO. Include installation, host, storage, network, power, support, monitoring, depreciation, insurance and engineering time.
- Price rental separately. Use realistic reserved hours and add transfer, storage, orchestration and management charges.
- Run sensitivity cases. Calculate 20%, 50% and 80% utilization, plus demand growth and decline. Treat break-even as a range rather than a single date.
- Choose the option you can reverse. If evidence is weak or demand is uncertain, preserve flexibility with an API or rental arrangement and revisit ownership after collecting production data.
Which option fits common workload sizes?
| Workload pattern | Usually best starting point | Reason |
|---|---|---|
| Under 100 million tokens per month, bursty or experimental | Cloud API | The OECD states that self-hosting benefits are not evident below this volume in its model, and the API avoids idle hardware |
| About 1 billion tokens per month with uncertain growth | API or rented GPU pilot | One representative H100 is mapped to this scale, but ownership payback depends on utilization; the OECD medium case takes 30.4 months |
| 10 billion tokens per month with sustained demand | Rental or owned multi-GPU service | The OECD maps this scale to two or three H100s; steady utilization can amortize infrastructure quickly |
| 50 billion tokens per month and predictable queue | Compare owned and rented clusters directly | The OECD maps this scale to eight H100s and reports rental materially below its modeled API spend, subject to excluded charges |
These rows are directional. They do not override quality, context, regional, licensing or reliability requirements, and they do not establish current retail GPU prices.
Bottom line for your workload
Cloud APIs usually win when volume is low, demand is spiky, or your team values simplicity more than infrastructure control. Self-hosting can win after sustained scale keeps accelerators productive long enough to amortize capital and operating costs. GPU rental often provides the best experiment and transition path because it avoids ownership risk while exposing you to a lower infrastructure unit cost than a token API. Recalculate with your actual token mix, cache rate, latency target, utilization and current provider and GPU prices before committing.
Quick Recap
Product prices and availability are accurate as of the date/time indicated and are subject to change. Any price and availability information displayed on Amazon at the time of purchase will apply.

