Recommended Free Tools
Zendesk and Salesforce Service Cloud both document reporting for support workload, speed, resolution, customer feedback, and team activity. Neither is established as the better platform for customer-service outcomes overall. To compare them fairly, define each KPI’s events and denominator, then align channels, reporting periods, and ticket or case states.
How KPI reporting differs between the platforms
The main difference is the data model and organization of the reporting—not proof that one platform delivers better service. Zendesk’s reporting is organized around tickets and Explore datasets, with prebuilt Support dashboards. Salesforce documents case reports and Service Cloud dashboards, including contact-center measures. See Zendesk’s metrics and attributes and dataset overview, alongside Salesforce’s prebuilt service reports and dashboards.


As an Amazon Associate I earn from qualifying purchases.
| KPI area | Zendesk documentation | Salesforce Service Cloud documentation | What to align before comparing |
|---|---|---|---|
| Workload and backlog | Ticket volume, solved and unsolved tickets, categories, and backlog. Zendesk defines backlog as tickets currently in new, open, pending, or on-hold status. | Case volume, cases by status, priority, and channel; dashboards also document closed and escalated cases. | Included states, snapshot versus period totals, duplicate or merged records, and the reporting interval. |
| Speed | First reply time and resolution time, with ticket, update-history, backlog-history, and SLA datasets documented. | Time to first close, time to close, and average handle time are documented in service reporting. | Start and end events, paused or pending time, reopened work, and whether the measure is elapsed time or agent handling time. |
| Resolution quality | Reopened tickets are among the documented support metrics. | First-contact resolution is included in Service Intelligence Cases Dashboard measures. Salesforce defines first-time resolution as cases closed with only one response, such as one email, voice call, or messaging session. | Exact qualifying event, denominator, treatment of multiple channels or responses, and whether a later reopen changes the result. |
| Customer feedback | Customer satisfaction is among the documented support metrics. | Cases Dashboard documents survey-based CSAT, including by channel. | Survey method, eligible cases, response rate, channel coverage, and the period in which feedback is attributed. |
| Customization and access | Custom ticket fields can be used in custom reports; they are not included in prebuilt dashboards. Report creation and dataset availability vary by plan and dataset. | Out-of-the-box reports cover cases and related service activity. Dashboard and analytics access can depend on edition, permissions, installation, or additional-cost capabilities. | Verify the exact org or account, plan or edition, permissions, data sources, and setup required for the reports you need. |
Define the KPIs before comparing dashboards
A familiar label is not a shared formula. For example, Salesforce distinguishes time to first close from time to close: the latter includes cases reopened and closed later, while the former records the first closure event. A Zendesk resolution-time figure should not be treated as equivalent without confirming its event and time rules. Likewise, Salesforce’s documented first-time resolution rule is not automatically interchangeable with another system’s one-touch or first-contact measure.
Zendesk’s backlog is a current-state count across new, open, pending, and on-hold tickets. It is not directly comparable to a Salesforce backlog unless the case statuses and time basis match. A snapshot of open work and a count of items received during a week answer different questions.
#1 Best Overall
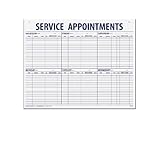
- 55 sheets per pad wtih a heavy chipboard backing
- Overall size: 17-1/2" x 22-1/2"
- 3-Hole punched for hanging on a wall
- Printed in blue ink
- Specify the event: Record what starts and stops the clock, what constitutes a reply or closure, and whether a reopen resets or extends the measure.
- Specify the population: State which tickets or cases qualify, which statuses count, and how merged, spam, transferred, or otherwise excluded records are handled.
- Specify the time rules: Document business hours versus calendar time and how pending, on-hold, or paused periods are treated.
- Specify the denominator: For rates such as first-contact resolution or reopen rate, state the eligible total as well as the qualifying count.
- Specify the slice: Keep channel, priority or severity, queue, category, and period consistent when comparing teams or systems.
Build a useful service KPI scorecard
Use a small set of measures that together explain demand, speed, outcome, and customer experience. The same names can work in both systems, but write down the calculation and source data beside each one.
- Demand: Tickets or cases received and closed during a defined period, segmented by channel and priority.
- Current workload: Open work by age and status. When using Zendesk’s documented backlog definition, count tickets in new, open, pending, or on-hold states and label it as a snapshot.
- First response: Measure elapsed time from a consistent arrival event to the first qualifying human response; separately define business-hour handling and channel-specific response events.
- Resolution: Track first closure and final resolution separately when cases can reopen. In Salesforce, time to first close and time to close have documented distinctions; confirm the corresponding Zendesk report’s rules before juxtaposing values.
- One-contact outcome: Use a written definition of a single interaction or response and an eligible-case denominator. Salesforce’s documented first-time resolution criterion is closure with only one response.
- Reopens: Report reopened tickets or cases against a stated closed-work population and period, rather than presenting a raw count without context.
- Customer satisfaction: Pair the score with the survey response rate, eligible population, and channel so a change in who answered is visible.
- Handling and SLA: Track handle time and SLA attainment only when the underlying start, stop, pause, and target rules are understood and comparable.
Where each platform’s reporting can help
Zendesk: ticket and dataset reporting
Zendesk describes Explore as a way to analyze service metrics and documents prebuilt Support dashboards. Its metrics include first reply time, resolution time, reopened tickets, customer satisfaction, ticket categories, and backlog. Separate datasets support different analyses, including tickets, updates history, backlog history, and SLA measures. Zendesk’s guidance on analyzing support metrics notes that custom ticket fields can be reported on with custom reports but are not part of prebuilt dashboards. Confirm which reports and datasets are available for your plan and configuration.
Rank #2

- 🚗 AUTOMOTIVE SERVICE-FOCUSED DESIGN: Tailored for automotive services, this Daily Car Service Record Book supports technicians and service writers in auto service shops, service truck operations, and dealership departments by organizing repair appointments, job authorizations, and maintenance tracking efficiently for professional workflow.
- 🚗 COMPREHENSIVE LOGGING SOLUTION: With 50 sheets per book structured 8.5" × 11" size, this record book provides ample space to log customer information, auto service needs, and additional repair authorizations, making it ideal for managing detailed service jobs, tracking mileage, and maintaining vehicle maintenance records across automotive services.
- 🚗 BUILT FOR SHOP ENVIRONMENTS: Constructed from high-quality paper and spiral-bound for durability, it withstands daily use in busy auto service bays and service truck operations. Pages are easy to flip, write on, or remove without tearing, providing a reliable solution for organized record-keeping.
- 🚗 USER-FRIENDLY RECORD KEEPING: Designed for quick and easy use, this record book includes fields for customer names, phone numbers, technician assignments, repair notes, flat-rate hours, and mileage logs, ensuring professionals can track all service details accurately without missing important information.
- 🚗 PROFESSIONAL AND VERSATILE: Whether scheduling jobs for a service truck, documenting auto service tasks in an independent shop, or maintaining dealership records, this car service record book functions as a daily planner, mileage log, and maintenance tracker, ensuring organized and professional workflow management for all automotive services.
Salesforce Service Cloud: case and service dashboards
Salesforce documents out-of-the-box reports for cases and related records or activity, including comments, emails, owners, contact roles, solutions, status and owner history, and support activity. Its Service Intelligence Cases Dashboard documents total, closed, and escalated cases; time to first close and time to close; first-contact resolution; survey CSAT and CSAT by channel; cases by priority, status, and channel; volume; and estimated cost per case. Consult Salesforce’s service metrics and Service Intelligence dashboards documentation. The Cases Dashboard documentation describes the specific measures and definitions. Availability can depend on edition, permissions, installation, or additional-cost capabilities, so verify these in the relevant org.
Free tools Windows power users keep installed
One-click scans. No signup required.
How to run a fair platform evaluation
- Choose a representative period and cohort. Use the same dates, channel mix, priority or severity bands, and staffing context for both systems.
- Write a KPI dictionary. For every measure, record its numerator, denominator, start and end events, exclusions, pause rules, and source dataset or report.
- Map data states. Match Zendesk ticket states to the Salesforce case statuses that represent the same work; do not assume that similarly named statuses behave alike.
- Validate report access. Check the actual plan or edition, permissions, installation, custom fields, and any additional-cost requirements for the required dashboards and datasets.
- Compare like with like. Break results out by channel, queue, priority, and category where possible, and investigate differences in data capture before interpreting a KPI gap as a performance difference.
- Document what cannot be aligned. If event definitions or source coverage differ, report the measures separately rather than manufacturing a direct comparison.
Choosing between Zendesk and Salesforce for KPI reporting
Choose based on the service data model and reporting you need, the channels and custom dimensions you use, and the setup and access available in your actual environment. Zendesk’s documented structure centers on tickets and Explore datasets; Salesforce documents case reporting and Service Cloud dashboards. If your operation depends on custom fields, specialized datasets, survey coverage, or contact-center measures, verify those requirements in the relevant account or org before treating a documented capability as included or ready to use.
The official vendor documentation describes available metrics and report types; it does not establish a controlled, like-for-like outcome advantage for either platform. A platform comparison should therefore be a configuration and measurement fit decision, not a claim that one vendor produces better customer service.
Quick Recap
Best Value

- Used Book in Good Condition
Product prices and availability are accurate as of the date/time indicated and are subject to change. Any price and availability information displayed on Amazon at the time of purchase will apply.




