Quick wins for a faster PC:
Scan for outdated or missing drivers - takes under a minuteDriver Scan →Clear out junk files and repair common Windows errorsFree Scan →Two meals can contain the same rice, pasta, vegetables, meat or sauce yet produce different blood-sugar readings. The usual reasons are the amount of available carbohydrate, the food’s physical structure, cooking and cooling, the balance and order of protein, fat and fibre, and differences in the person and the measurement. Ingredients are only one part of the meal; portion, preparation and context determine how quickly and how much glucose appears in the blood.
The short answer: “similar ingredients” does not mean “the same meal”
Imagine two plates made with chicken, vegetables and pasta. If one contains twice as much pasta, its carbohydrate load is different. If one uses freshly cooked pasta and the other uses pasta that was cooled and reheated, the starch structure is different. If the vegetables and chicken are eaten first on one occasion but the pasta is eaten first on another, digestion occurs in a different sequence. Sleep, activity, stress, medication, illness and measurement timing can also change the reading.
As an Amazon Associate I earn from qualifying purchases.
For that reason, a single post-meal glucose value cannot fully explain your response. Compare the details of the meals and the circumstances around them rather than judging an ingredient in isolation.
1. Portion size and available carbohydrate are the biggest starting points
Two servings can look similar while containing very different amounts of carbohydrate. A larger scoop of rice, a thicker slice of bread or extra pasta increases the carbohydrate entering digestion. The American Diabetes Association review Dietary Carbohydrate (Amount and Type) in the Prevention and Management of Diabetes identifies both carbohydrate quantity and type as important determinants of glycemic response.
#1 Best Overall

- 𝗘𝗳𝗳𝗼𝗿𝘁𝗹𝗲𝘀𝘀 𝗪𝗲𝗶𝗴𝗵𝗶𝗻𝗴: Supports 5 units (oz/lb:oz/fl'oz/g/mL), tare function, and includes 2 AAA batteries for hassle-free operation
- 𝗣𝗿𝗲𝗰𝗶𝘀𝗲 𝗥𝗲𝘀𝘂𝗹𝘁𝘀: Accurately weighs up to 11 lb/5 kg with 1 g increments
- 𝗦𝗶𝗺𝗽𝗹𝗲 & 𝗖𝗼𝗺𝗽𝗮𝗰𝘁: The small and sleek scale is a perfect fit for most kitchens, occupying little space and easily storable in cabinets
- 𝗘𝗮𝘀𝘆 𝘁𝗼 𝗖𝗹𝗲𝗮𝗻: Just wipe down the 304 food-grade stainless steel surfaces to keep clean
- 𝗟𝗖𝗗 𝗗𝗶𝘀𝗽𝗹𝗮𝘆: Backlit LCD screen with large fonts for easy reading
“Available carbohydrate” means carbohydrate that can be digested and absorbed, rather than the food’s total weight. A 200-gram serving of a watery vegetable and a 200-gram serving of cooked grains weigh the same but do not supply the same carbohydrate. Fibre, water and air change weight and volume without contributing equivalent digestible carbohydrate.
What to compare
- Weigh or measure the carbohydrate-containing portion, such as cooked grains, pasta, potatoes, bread or legumes.
- Record sauces, sweetened drinks and desserts; they can add carbohydrate even when the main plate looks unchanged.
- Note whether the listed amount is cooked or uncooked. Water absorbed during cooking changes weight without adding carbohydrate.
A digital kitchen food scale can help you compare portion weights, but it does not measure glucose or reveal the food’s available-carbohydrate content. Use labels or a trusted nutrition database for carbohydrate information, and keep any changes to eating or medication within your clinician’s plan.
2. Carbohydrate type and food structure change digestion
Carbohydrate is not a single substance with one predictable effect. The source, particle size, intactness of plant cells and degree of processing influence how quickly digestive enzymes reach starches and sugars. A whole grain, intact bean or firm piece of fruit has a different structure from flour, purée or a finely milled snack made from the same broad ingredients.
The Tool Desk
Outbyte PC Repair FREERepair Windows errors before they cause bigger problemsFix Now →Outbyte Driver Updater FREEScan for outdated or missing drivers - takes under a minuteDriver Scan →The study Variability of the glycemic response to single food products in healthy subjects illustrates why foods with broadly similar macronutrients can still produce different glucose responses. The practical implication is to compare the actual form of the carbohydrate, not just its name or macronutrient label.
Examples of structural differences
- Whole kernels versus flour made from those kernels.
- Al dente pasta versus very soft pasta.
- Fruit eaten whole versus juice or a strained purée.
- Beans left intact versus blended into a smooth spread.
These examples do not guarantee a specific reading for every person. They show why an ingredient list is an incomplete description of the meal’s digestive behavior.
Rank #2
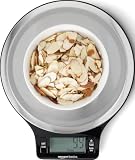
- Digital kitchen scale with food-safe, BPA-free plastic components
- Stainless steel platform with wide LCD screen
- Weighs up to 11 pounds (2 grams minimum, up to about 5000 grams); displays results in pounds, ounces, grams, fluid ounces, and ml
- Tare button for measuring just the food, minus the container weight
- Battery operated; (2) AAA batteries included
3. Cooking, cooling and reheating can alter a starchy meal
Heat changes starch. Cooling can allow some starch molecules to realign into a form that is digested differently, and reheating changes the final texture again. A randomized crossover trial, Method of Food Preparation Influences Blood Glucose Response to a High-Carbohydrate Meal, compared freshly cooked pasta with pasta that was cooled and pasta that was cooled and reheated.
In that particular trial, cooling and reheating were associated with a faster return toward baseline than the freshly cooked condition, and reheated pasta had a significantly lower glucose area under the curve than freshly cooked pasta. The result belongs to that meal, recipe, cooking method and study population; it is not a universal instruction to cook, chill or reheat every starch.
Do these 3 things before closing this tab:
1Clear out junk files and repair common Windows errors2Scan for outdated or missing drivers - takes under a minute3Repair Windows errors before they cause bigger problemsHow to make a fair preparation comparison
- Keep the recipe, serving weight and meal timing as similar as possible.
- Record whether the starch was freshly cooked, refrigerated, frozen or reheated, and for how long.
- Use the same measuring window after eating when comparing readings.
- Repeat the comparison on more than one occasion before drawing a personal conclusion.
Food safety still comes first: refrigerate cooked food promptly and reheat it according to ordinary food-safety guidance. A lower reading in one trial does not make unsafe storage acceptable.
4. Protein, fat and fibre change the digestion context
A mixed meal is not simply the sum of separate ingredients. Protein, fat and fibre can affect stomach emptying and the timing of glucose absorption. Two plates with the same pasta quantity may therefore produce different curves if one has more vegetables, beans, cheese, oil or meat.
The effect is often about timing rather than a guaranteed reduction in total glucose exposure. A meal higher in fat may delay the rise, with glucose appearing later; a fibre-rich meal may slow digestion; and protein can influence hormonal signals and appetite. Individual responses differ, so a delayed peak should not automatically be interpreted as a better overall response.
Rank #3

- 𝗠𝗮𝘅 𝗖𝗮𝗽𝗮𝗰𝗶𝘁𝘆: Weigh objects as heavy as 22 lb/10 kg and as light as 2 g in increments of 1 g
- 𝗜𝗣𝗫𝟲 𝗪𝗮𝘁𝗲𝗿𝗽𝗿𝗼𝗼𝗳 𝗗𝗲𝘀𝗶𝗴𝗻: Features an IPX6 waterproof design, allowing you to easily measure liquids and wipe the scale clean
- 𝗧𝘆𝗽𝗲-𝗖 𝗥𝗲𝗰𝗵𝗮𝗿𝗴𝗲𝗮𝗯𝗹𝗲 𝗕𝗮𝘁𝘁𝗲𝗿𝘆: The scale features a rechargeable battery and comes with a USB-C charging cable
- 𝟱 𝗨𝗻𝗶𝘁𝘀: Choose between grams, ounces, pounds and ounces, milliliters (milk and water), and fluid ounces (milk and water)
- 𝗕𝗼𝗻𝘂𝘀 𝗙𝗲𝗮𝘁𝘂𝗿𝗲𝘀: Use the tare feature and hold function for added convenience
Compare the whole plate
| Meal detail | Why it can matter | What to record |
|---|---|---|
| Carbohydrate portion | Sets a major part of the glucose load | Weight or household measure and estimated grams of available carbohydrate |
| Fibre-rich foods | Can alter digestion speed and meal density | Vegetables, legumes, whole-food portions and preparation |
| Protein | Changes the mixed-meal context and may affect later glucose | Type and approximate portion |
| Fat | Can slow stomach emptying and shift the timing of the rise | Added oils, sauces, cheese, nuts and fatty cuts |
5. The order in which you eat components may change the post-meal rise
Meal sequence is another possible explanation when the ingredients and portions appear unchanged. In a small crossover pilot reported in Food Order Has a Significant Impact on Postprandial Glucose and Insulin Levels, 11 adults with type 2 diabetes treated with metformin ate the same meal in different orders. Glucose after the meal was lower when vegetables and protein came before carbohydrate than when carbohydrate came first.
Because the sample was small and the design tested a specific meal and population, this is a study finding, not a promise that the order will produce the same result for everyone. A later report, Carbohydrates-Last Food Order Improves Time in Range and Reduces Glycemic Variability, also examines a carbohydrates-last pattern. Its title describes the reported outcome, but it should not be treated as a universal substitute for individualized care.
If you want to observe sequence safely
- Keep the ingredients and portions constant.
- On one occasion, eat non-starchy vegetables and protein before the carbohydrate; on another, use your usual order.
- Keep the time spent eating and the post-meal activity similar.
- Discuss recurring patterns with your healthcare professional, especially if you use glucose-lowering medication.
6. Different people can respond differently to the same plate
Biology makes identical meals diverge between people. Insulin sensitivity, gut microbiota, liver glucose production, sleep, recent exercise, stress, illness, medications and the timing of previous meals all contribute.
The PREDICT 1 study, published in Human postprandial responses to food and potential for precision nutrition, examined 1,002 twins and unrelated healthy adults in the United Kingdom. It found substantial between-person variation after identical meals. The investigators reported a post-meal glucose-response coefficient of variation of 68% in the study population. That statistic describes variation across participants; it does not mean an individual’s glucose will vary by exactly 68%.
Consequently, another person’s “safe” portion or a population average cannot reliably predict your own curve. General nutrition guidance can explain mechanisms, but it cannot replace a diagnosis or a treatment plan.
Rank #4

- 【PRECISE WEIGHT】 The digital food scale built-in four high-precision load sensors, quickly and accurately response 1g or 0.1oz increments when adding ingredients, its measuring range: 0.1oz to 22 lbs and 3g to 10kg(Min. weigh at 0.1oz or 3g).
- 【MULTIFUNCTION LARGE SCALE】 9"x6.3" platform and Large lcd display for easy readout in g, kg, lb: oz, fl.oz and ml. This digital weight scale is for better cooking, baking, tracking intake, weight loss and postage.
- 【PRACTICAL DESIGN】 The food scale is designed with tempered glass for strong bearing, sleek stainless steel top surface for anti-fingerprint and easy clean, with a attached hook for convenient storage.
- 【EASY TARE / ZERO OUT】 Convenient tare button for tare calculation allows you to subtract the weight of plate or container, making it easy to achieve accurate readouts of ingredients.
- 【GREAT SUPPORT】2 AAA batteries included. We are always stand behind our kitchen scales, please feel free to reach to us if you have any issues.
7. The same person may not respond identically on two days
Even when you reproduce your own meal, the result may move. A 2023 study, Duplicate meals and individual glycemic responses measured by CGMs, found that continuous-glucose-monitor responses to duplicate meals were not perfectly repeatable across eating occasions.
Possible contributors include sleep, stress, exercise before or after eating, menstrual-cycle stage, illness, alcohol, the previous meal and ordinary biological fluctuation. Device factors also matter: sensor placement, calibration, lag between interstitial fluid and blood glucose, and the exact time a reading is taken can all affect the number.
Why one excursion is weak evidence
- A single peak may reflect an unusual day rather than a stable response.
- Comparing a 60-minute reading with a 120-minute reading can make two identical curves look different.
- CGM values represent interstitial glucose and may lag behind blood glucose during rapid changes.
Repeated observations under reasonably similar conditions are more informative than one dramatic result, but the available evidence does not establish a universal number of repetitions needed for a “reliable” personal test.
Independent reader supportYour contribution helps us test, update, and keep practical guides available for everyone.8. A practical method for comparing two similar meals
Use this framework to identify what changed without turning a home observation into a medical experiment.
- Describe both meals precisely. List each carbohydrate source, its cooked or uncooked state, sauces, drinks, protein, fat and fibre-rich foods.
- Quantify portions. Record the weight or household measure of the main carbohydrate and estimate available carbohydrate from a nutrition label or database.
- Document preparation. Note cooking time, firmness, cooling duration, storage and reheating.
- Record sequence. Write down whether vegetables, protein or carbohydrate were eaten first and how long the meal lasted.
- Match the measurement window. Compare readings taken at the same interval after the first bite, using the same device when possible.
- Log context. Note sleep, stress, exercise, illness, medication timing and the previous meal.
- Look for a pattern, not a spike. If a difference persists, take the record to your clinician rather than changing medication or deliberately provoking high readings.
9. Worked comparison: two pasta dinners
Suppose Dinner A contains 180 grams of freshly cooked pasta, chicken, a small serving of vegetables and a light sauce. Dinner B contains 180 grams by weight of pasta that was cooled and reheated, the same chicken and vegetables, but a larger amount of sauce and oil. The pasta weight is matched, yet the meals differ in starch history, sauce composition and fat.
Best Value

- Contemporary Slim Design: Made of Stainless Steel Material; It is easy to use and clean; Provides accurate weight data with a user-friendly control panel and system; With high precision sensors to ensure correct performance and readouts
- Multiple Unit Conversion Setting: You can easily switch to any unit that you need; It can show units in the following: g / kg/lb/oz/ml/milk ml; Yes! It includes milk volume measurement
- Low Energy Consumption with Included Battery: This unit comes with batteries and doesn’t consume too much power; Plus it has an auto shut off feature
- Backlit Display (Easy to See and Read Panel): The unit has a negative white digital display so it is easy to read and see even in not well-lit rooms
- After Sales Support, and Trusted Customer Support Team assist you with any questions that might arise about your kitchen scale. We take pride in our work and want you to have a great experience from beginning to end
Now suppose Dinner C uses 240 grams of freshly cooked pasta with the original sauce. Its ingredient list may be nearly identical to Dinner A, but the carbohydrate quantity is higher. If the reading is higher, portion size is a more direct explanation than the pasta brand or the vegetable choice.
To compare fairly, hold the recipe, portion, preparation, sequence, eating time and measurement interval constant, changing only one factor at a time. Even then, repeat-day variation means the result should be interpreted as a tendency rather than a guarantee.
10. When a different reading deserves medical attention
Seek medical advice for recurring highs or lows, symptoms of hypoglycemia or hyperglycemia, or readings that conflict sharply with how you feel. Do not alter insulin, tablets or other treatment based solely on a meal comparison. People with diabetes should follow their prescribed monitoring schedule and ask their care team how to interpret unexpected results.
Crashes, No Sound, or Screen Glitches?
Random freezes, missing sound and display glitches usually trace back to one bad driver. Find and replace yours safely.Free scan · under a minutePC Slower Than It Used to Be?
A free scan shows the junk files, broken settings and background clutter dragging Windows down - then fixes them in one click.Free scan · Windows 10 & 11The central lesson is straightforward: two meals can share ingredients while differing in carbohydrate dose, structure, preparation, composition, sequence and context. Those differences—and normal variation in people and measurements—are why the glucose response is not determined by the ingredient list alone.
Quick Recap
Product prices and availability are accurate as of the date/time indicated and are subject to change. Any price and availability information displayed on Amazon at the time of purchase will apply.




