Recommended Free Tools
Data center water figures describe different things: water withdrawn, water consumed, or water intensity—a ratio of water to an activity such as IT energy. They are not interchangeable. To interpret a number, first identify its water boundary and numerator, then its denominator, period, geography and measurement method.
What is the difference between water withdrawal and consumption?
Withdrawal is water removed from surface water or groundwater for use. Some of it may be returned after use. Consumption is the portion that does not return to the local water environment and is no longer readily available for another local use; evaporation is one way water can be consumed. Water discharged or recirculated may not count as consumed, depending on the accounting boundary.
As an Amazon Associate I earn from qualifying purchases.
The U.S. Geological Survey notes that “Not all water withdrawn for human use is lost, much of it returns to the environment.” That distinction applies to data centers too: a withdrawal total should not be described as the amount consumed unless the return flows and measurement boundary are clear. See the USGS explanation of water use in the United States.
Crashes, No Sound, or Screen Glitches?
Random freezes, missing sound and display glitches usually trace back to one bad driver. Find and replace yours safely.Free scan · under a minuteWindows Errors? Fix Them Before They Spread
Repair common Windows errors and clear accumulated junk for a smoother, more stable PC - no reinstall needed.Free scan · no reinstallWhat does data-center WUE measure?
Water Usage Effectiveness (WUE) is a water-intensity metric: it relates water consumption to IT equipment energy use. In its 2024 U.S. report, Lawrence Berkeley National Laboratory (LBNL) defines WUE as total data-center water consumption divided by IT electricity demand, reported in liters per kilowatt-hour (L/kWh). A WUE value is therefore not a total volume of water; it is a ratio whose meaning depends on the numerator, denominator, reporting period and boundary.
#1 Best Overall

- 17 IMPORTANT PARAMETERS: The Varify Premium Drinking Water Test Kit offers an unrivaled, complete analysis of your drinking water by testing for 17 essential parameters. This includes crucial tests for chlorine, fluoride, lead, iron, bacteria, and more, ensuring that you're fully informed about the quality of your water. With this extensive range of testing capabilities, you can detect contaminants and imbalances that could affect your health, providing a holistic view of your water's safety.
- PREMIUM QUALITY: Varify stands out with its professional-grade quality, ensuring that every test strip in the kit meets the standards of precision and reliability. Crafted with meticulous attention to detail, this kit is designed to provide you with a dependable and thorough analysis of your water's composition.
- EASY TO USE: Varify's water test strips and Bacteria Test kits feature a user-friendly, color-coded system for quick and precise water quality assessments. With clear color changes indicating various parameters, these strips make complex data easily understandable, ensuring you can evaluate your water's safety effortlessly in just minutes.
- ACCURATE AND RELIABLE: Varify's water test kit comes with 100 strips in 5 separately sealed pouches (20 strips each), preserving freshness and extending shelf life for dependable testing. It also includes 2 easy-to-use bacteria tests that deliver results in 48 hours, ensuring thorough and accurate assessment of your water's safety and cleanliness. This design ensures precision and convenience in monitoring your water quality.
- WATER TESTING KITS THAT GIVE BACK: With every Varify test kit, not only do you secure the safety of your drinking water with our precise and easy-to-use testing solutions, but you also contribute to a global cause. A portion of proceeds goes to Water For Good, fighting water poverty in Central Africa. This means each test not only brings peace of mind to you but also supports #CleanWaterWorldwide, making a real difference in communities in need.
ISO/IEC 30134-9:2022 specifies WUE as a key performance indicator for quantifying data-center water consumption during the use phase and for reporting operational water intensity. The standard’s published first edition is dated March 2022, and its official page indicates that revision work is underway. For category-specific calculation and reporting requirements, consult the ISO/IEC 30134-9:2022 standard page.
Site WUE and source water answer different questions
WUE (site) concerns water consumed on-site, mainly for cooling and other facility operations. WUE (source) also accounts for water consumption associated with generating the electricity the data center uses. A site-only figure does not represent that electricity-related water footprint. LBNL’s 2024 report distinguishes these categories in its U.S. estimates; the ISO standard defines the WUE KPI and reporting framework.
Rank #2

- Clear Range: This house water testing kit offers clear, easy to read results and acceptable ranges for all substances. The water contaminant tester delivers clear results on any type of water
- Easy to Use: The water hardness test kit for water softener is as easy as adding the water, setting a timer, and reading the results. The pH strips for water testing come with an easy-to-read results guide
- Easy to Understand: The water tester for drinking water comes with a clear guide on the outside of the bottle that lines up with each strip, from alkaline level to soft characteristic readings
- Data Sheet Included: These water testing kits for drinking water include a data sheet to record readings for later analysis. The complete water tester for chemicals has it all
- Peace of Mind: This well water test kit comes with a 17-in-1 test strip and 2 separate bacteria tests to check for coliform and e coli. Knowing what’s in the water for peace of mind is easy
Why can’t water intensity figures always be compared?
Water intensity is a ratio, and the denominator changes what the ratio says. Water per IT kWh is not comparable as-is with water per square foot, per unit of workload, or another activity measure. Likewise, a consumption intensity is not interchangeable with a withdrawal total, a company-wide annual volume or an estimate that includes power generation.
Before comparing two figures, check that they share the following:
Rank #3
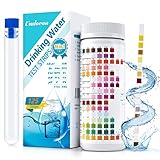
- 🌍 【16-in-1 Water Test Kit】- With Umlecoa water quality test kit, you may know level of Water Hardness, Free Chlorine, Iron, Copper, Lead, Nitrate, Nitrite, Mps, Total Chlorine, Fluoride, Cyanuric Acid, Ammonia Chloride, Bromine, Total Alkalinity, Carbonate, pH easily. Covers main influencing factors which pollute your swimming pool ,hot tub or drinking water quality.
- 🌍【Fast & Accurate Results】- Get accurate results in minutes in just 3 steps. ①Dip an testing strip into water for 2 sec. ②Remove it and hold horizontally for 30-60 sec (Please don't shake excess water off). ③Compare to color chart with up to 99% accuracy. It’s never been this easy to take a drinking water testing, even a child can do it, save your time and money from long trip to laboratory.
- 🌍 【Wide Applicability】- Umlecoa 16 in 1 water test strips can be applied to a wide range of water inspection, including drinking water, pool, hot tub, spa, pond, aquarium and industrial waste water and more water quality test, it is ideal for water testing at home, laboratory or school. For the health of you and your family, please use the professional water test strips to detect water quality standards.
- 🌍 【Home Test Kit】- Package includes: 125 test strips, test tube with cap (help with testing). Ready to use, for your convenience. All kits have safety measures to ensure the quality of your test strips. Economical 125pcs test strips for water in a handy bottle with color card, easy to carry to test anywhere according to your own needs (Tip: Be sure to tighten the cap after taking out the test strip).
- 🌍【Healthy Water & Happy Life】- We promise, we follow a strict quality control on each package and each batch, so you never need to worry about inconsistent or faulty readings on these test strips. If you have any concerns about our water test kit, please contact us now! Umlecoa after-sales service team is online 7*24 hours. Our expert team will provide an efficient and satisfactory solution.
- Water quantity: withdrawal or consumption, and whether the numerator covers all facility water or a subset such as cooling.
- Boundary: on-site/direct water only, or also off-site water associated with electricity generation.
- Denominator and units: for example, liters per IT kWh rather than water per area or workload.
- Time and geography: the same reporting period and a clearly stated location or coverage.
- Method: metered, company-reported, estimated or modeled, with assumptions identified.
- Local context: water source, local availability and return flows, plus what happens to water after use.
ISO’s KPI framework and LBNL’s definitions make the category and boundary important; the California-focused Berkeley Law report also describes how limited and aggregated facility-level disclosures can make like-for-like comparisons difficult. The sources here do not establish a universally comparable, independently verified facility-level dataset.
What do published U.S. water-use estimates show?
LBNL’s 2024 report models U.S. data-center electricity and water use; its figures are national estimates under the report’s assumptions, not direct readings from every facility. The direct-water estimates are:
Rank #4

- Every test counts: Water insecurity can cause health problems, and having suffered from it myself, I am keenly aware that I do not want to see any more families affected. HEVEIS is committed to encouraging families in the United States to be aware of water quality issues and to take steps to test water quality regularly and resolve problems in a timely manner. To eliminate the physical effects of water quality. Small actions add up to a big difference, so take action now for the health of you and your family
- Complete and comprehensive: Water testing kits for drinking water offers the most extensive and comprehensive drinking water test kit, so if you want to test your drinking water quality quickly and comprehensively, it's all you need! Once you have it, you'll have peace of mind for the whole family
- Easy to use for everyone: No need to be a specialist, even a child can do it independently; results are obtained in 3 simple steps and the home water test kit is accompanied by clear graphic instructions
- Easy-to-read, real-time record: Still worried about the bottle's colorimetric difficulties and indicator results you can't remember? The water quality test kit is equipped with an independent color comparison chart and record card; by comparing the test strip with the color comparison chart, the results are instantly available and can be recorded on the record card immediately. The record card is also convenient for later analysis of water quality
- In-depth understanding of water quality: Based on actual test results and compared to the EPA standards book, you can clearly understand the meaning and implications of each indicator to help protect your and your family's health. The drinking water testing kit includes EPA standards and detailed descriptions of each indicator. Please contact us if you require a numerical description
| Measure | Estimate | What it covers |
|---|---|---|
| Direct water consumption, 2014 | 21.2 billion liters | U.S. data centers; modeled estimate reported by LBNL in 2024. |
| Direct water consumption, 2023 | 66 billion liters | U.S. data centers; modeled estimate reported by LBNL in 2024. Hyperscale and colocation facilities accounted for 84% of this estimated total. |
| Indirect water consumption, 2023 | Nearly 800 billion liters | Water associated with electricity used by U.S. data centers, estimated using LBNL’s electricity-grid modeling and assumptions; not site WUE. |
| Average indirect-water intensity, 2023 | 4.52 L/kWh | LBNL’s national average for water associated with data-center electricity use under its modeling; not a site-WUE figure. |
The indirect figures describe water associated with electricity generation, not water consumed at the data-center site. They should not be added to or compared with a site-only measure without making the difference in boundaries explicit. For definitions and methodology, see the LBNL 2024 United States Data Center Energy Usage Report.
Quick wins for a faster PC:
Repair Windows errors before they cause bigger problemsFix Now →Scan for outdated or missing drivers - takes under a minuteDriver Scan →Clear out junk files and repair common Windows errorsFree Scan →Why do water-use figures differ among facilities?
Cooling is the principal direct use of water at data centers, but demand depends on cooling design, climate, facility type and size, and operating practices. Facilities may combine air, liquid, evaporative and free cooling. Evaporative systems can use more water; systems that use less water may require more energy. As the Berkeley Law Center for Law, Energy & the Environment puts it, “Cooling systems that use less water often do so at the cost of increased energy consumption, and vice versa.”
Best Value

- The Earth Force Low Cost Water Monitoring Kit can be used to test fresh, brackish, or saline aquatic environments.
- This complete kit includes a manual with step-by-step, diagrammed instructions; an easy-to-use laminated color chart, and all the necessary apparatus and non-hazardous TesTabs to test ten water samples (three samples for coliform).
- A popular, economical tool for learning the basics of water quality.
- Students will have fun analyzing sample water for eight different test factors.
Closed-loop arrangements and nonpotable water sources can reduce pressure on drinking-water supplies, but the effect depends on facility design and local conditions. A single WUE ratio cannot by itself show the local impact: water availability, return flows, cooling choices and the electricity-generation mix also matter.
How should company and sector water percentages be read?
Percentages describing water consumed can add context to withdrawal figures, but their scope matters. Berkeley Law’s 2026 California report relays several estimates and company disclosures; they describe different populations and should not be treated as universal rates.
| Reported figure | Scope and attribution | How to interpret it |
|---|---|---|
| About 40% on-site | International Energy Agency estimate as reported by Berkeley Law in 2026. | An estimate of the share of global data-center water consumption occurring on site, not a rule for each facility. |
| Roughly 17%–50% on-site | Range of other U.S. and European estimates cited by Berkeley Law in 2026. | Estimates with differing scope; not a single agreed sector-wide value. |
| About 76% consumed | Equinix company data for its global data-center operations, summarized by Berkeley Law in 2026; the remaining 24% is reported as discharged to municipal sewers or surface waters. | A company-level aggregate, not a typical facility ratio. |
| About 79% consumed | Google company data on water withdrawn globally by its data centers, summarized by Berkeley Law in 2026. | A company aggregate, not a sector average. |
Berkeley Law notes that facility-level details are often opaque and corporate water reporting may be voluntary and aggregated. Its report, Regulating Data Center Water Use in California, discusses these disclosures and the state-level context.
What’s actually slowing this PC down?
Pick the symptom - the matching free tool is one click away.
Quick Recap
Product prices and availability are accurate as of the date/time indicated and are subject to change. Any price and availability information displayed on Amazon at the time of purchase will apply.




