The Tool Desk
Outbyte PC Repair FREERepair Windows errors before they cause bigger problemsFix Now →Outbyte Driver Updater FREEFix the driver behind crashes, sound loss and screen glitchesFind Drivers →tcpdump is a command-line packet capture tool used to inspect network traffic directly from a terminal. It can capture packets on specific interfaces, filter by protocol, port, host, or network, and display packet details in real time for troubleshooting connectivity, application, DNS, HTTP, SSH, and other network issues.
With the right capture expressions, tcpdump can narrow noisy traffic down to exactly what matters, such as TCP connections to a web server, UDP DNS queries, ICMP ping tests, or traffic between two hosts. Captures can also be written to PCAP files, making it possible to review them later with tcpdump or open them in tools such as Wireshark for deeper analysis.


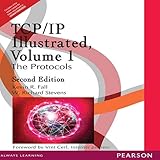


As an Amazon Associate I earn from qualifying purchases.
TCPDump Basics: Interfaces, Permissions, and Capture Syntax
Before filtering for a protocol or port, confirm which network interface tcpdump should listen on and whether your account has permission to capture packets. On most Linux systems, packet capture requires root privileges or specific capabilities because tcpdump needs access to raw network traffic. The most common pattern is to run commands with sudo, especially on servers where interfaces such as eth0, ens33, enp0s3, wlan0, or lo may be present.
Recommended Free Tools
List available capture interfaces with the following command:
#1 Best Overall
sudo tcpdump -D
This prints numbered interfaces and names that tcpdump can use. On a typical host, you may see a physical Ethernet adapter, a wireless adapter, the loopback interface, container bridges, VPN tunnels, or virtual interfaces. To capture on a specific interface, use -i. For example, this command listens on eth0 and prints matching packets to the terminal:
sudo tcpdump -i eth0
If you are unsure which interface is carrying the traffic, you can capture on all supported interfaces with -i any on Linux:
sudo tcpdump -i any
The basic tcpdump syntax is a command followed by options and then an optional capture filter. The general structure is:
sudo tcpdump [options] [filter expression]
Options control how tcpdump captures and displays packets. Filters decide which packets are included. A simple capture filter might select ICMP traffic, DNS traffic, a host, or a port. For example, this displays ICMP packets on all interfaces:
sudo tcpdump -i any icmp
Common startup options
- -i <interface>: Selects the interface to capture from, such as eth0, wlan0, lo, or any.
- -n: Disables hostname lookups, keeping output faster and showing raw IP addresses.
- -nn: Disables both hostname and service-name lookups, so ports appear as numbers instead of names such as https or domain.
- -v, -vv, -vvv: Increases output detail for packet headers and protocol fields.
- -c <count>: Stops after capturing a specific number of packets.
- -s <bytes>: Sets the snapshot length. Use -s 0 to capture full packets.
- -q: Prints less detail, useful when you only need a quick traffic check.
For troubleshooting, -nn is often a good default because it avoids DNS lookups that can slow down output or create extra network traffic. This command captures 20 packets on the primary interface and prints IP addresses and numeric ports:
sudo tcpdump -i eth0 -nn -c 20
To see more packet detail, add verbosity. For example, when checking TCP handshakes, TTL values, flags, and packet lengths, the following command provides a clearer view:
sudo tcpdump -i eth0 -nn -vv tcp
By default, tcpdump captures enough bytes from each packet to inspect headers and some payload, depending on the platform and version. If you plan to save traffic for later analysis in Wireshark or need complete packets for application-layer inspection, set the snapshot length to zero:
sudo tcpdump -i eth0 -nn -s 0
Reading basic tcpdump output
A typical line includes a timestamp, protocol, source address and port, destination address and port, TCP flags if applicable, sequence or acknowledgment details, and packet length. For example, traffic from a client to a web server may appear as a source IP with a high ephemeral port connecting to a destination IP on port 443. With -nn, tcpdump keeps those values numeric, which makes it easier to match them against firewall rules, load balancer logs, and application configuration.
Once the interface, permissions, and base syntax are clear, tcpdump filters become much easier to build. Start with a broad capture, verify that packets are visible on the expected interface, then narrow the command with protocol, host, and port expressions to isolate the traffic involved in the issue.
Filtering Traffic by Protocol
Protocol filters are the fastest way to reduce tcpdump output when you already know the general type of traffic you need to inspect. Instead of capturing every packet on an interface, you can ask tcpdump to show only TCP, UDP, ICMP, ARP, or other protocol traffic. The basic pattern is to place the protocol name after the interface option: tcpdump -i eth0 tcp. This captures only TCP packets on eth0, which is useful when investigating web, SSH, SMTP, database, or other connection-oriented services.
For UDP-based services, use udp as the filter. For example, tcpdump -i eth0 udp displays UDP traffic such as DNS queries, NTP packets, syslog messages, VoIP signaling, and many service discovery protocols. UDP does not have the same connection setup and teardown behavior as TCP, so packet timing, source and destination ports, and payload visibility are often more useful than session state when troubleshooting.
Common protocol filter examples
- tcpdump -i eth0 tcp captures TCP traffic on eth0.
- tcpdump -i eth0 udp captures UDP traffic on eth0.
- tcpdump -i eth0 icmp captures IPv4 ICMP traffic, such as ping requests and replies.
- tcpdump -i eth0 icmp6 captures IPv6 ICMP traffic, including neighbor discovery and router advertisements.
- tcpdump -i eth0 arp captures ARP requests and replies on an IPv4 Ethernet network.
- tcpdump -i eth0 ip captures IPv4 packets only.
- tcpdump -i eth0 ip6 captures IPv6 packets only.
ICMP filters are especially helpful when validating basic connectivity. A command such as tcpdump -i eth0 icmp lets you watch ping traffic in real time and confirm whether echo requests and replies are crossing the interface. If a remote host sends ping requests but no replies leave the system, the issue may be local firewalling, routing, or host configuration. If no ICMP packets appear at all, the packets may be blocked upstream or arriving on a different interface.
Rank #2
ARP filtering is useful for diagnosing local network problems that happen before IP communication succeeds. With tcpdump -i eth0 arp, you can see whether a host is asking for the MAC address of a gateway, whether another device answers, and whether repeated ARP requests go unanswered. This is a practical check for duplicate IP addresses, incorrect VLAN placement, missing gateway presence, or Layer 2 reachability problems.
Improving protocol output readability
Protocol filters can be combined with display options to make output easier to interpret. Use -n to prevent DNS and service name lookups, which makes captures faster and keeps addresses and ports numeric. Use -nn to disable both host and port name resolution. For packet contents, -X prints packet data in hex and ASCII, while -A prints ASCII payload where readable. For example, tcpdump -i eth0 -nn -X udp captures UDP traffic without name lookups and shows packet bytes for closer inspection.
| Goal | Command |
|---|---|
| Show only TCP traffic | tcpdump -i eth0 -nn tcp |
| Show only DNS-style UDP traffic before adding port filters | tcpdump -i eth0 -nn udp |
| Watch ping traffic | tcpdump -i eth0 -nn icmp |
| Inspect local address resolution | tcpdump -i eth0 -nn arp |
When protocol names are not enough, tcpdump also supports protocol numbers through packet expressions, but names are clearer for day-to-day troubleshooting. Start with a broad protocol filter, confirm that the expected traffic is visible, then narrow the capture further with host, network, and port conditions as needed.
Windows Errors? Fix Them Before They Spread
Repair common Windows errors and clear accumulated junk for a smoother, more stable PC - no reinstall needed.Free scan · no reinstallCrashes, No Sound, or Screen Glitches?
Random freezes, missing sound and display glitches usually trace back to one bad driver. Find and replace yours safely.Free scan · under a minuteCapturing Traffic by Source or Destination Port
Port filters are among the most common tcpdump filters because they let you narrow a capture to a specific service such as SSH, HTTP, HTTPS, DNS, SMTP, or a custom application port. The general syntax is port NUMBER, which matches packets where either the source or destination port is that number. For example, to capture all SSH traffic on any interface selected by -i, use:
sudo tcpdump -i eth0 port 22
This displays packets where TCP or UDP port 22 appears on either side of the conversation. Since SSH uses TCP, you can make the filter more precise by adding the protocol: sudo tcpdump -i eth0 tcp port 22. This avoids unrelated UDP traffic if a service happens to use the same port number.
Filtering by destination port
Use dst port when you only want traffic going to a service. This is useful when checking whether clients are reaching a server process. For example, to watch inbound HTTPS requests arriving on interface ens160, run:
sudo tcpdump -i ens160 tcp dst port 443
If a web server is not receiving connections, this command can quickly show whether packets are arriving at the network interface. If you see SYN packets coming in but the application still fails, the issue may be with the local service, firewall rules, TLS configuration, or routing of return traffic. For plain HTTP, change the port to 80: sudo tcpdump -i ens160 tcp dst port 80.
Filtering by source port
Use src port to capture packets coming from a particular service port. This is helpful when you want to inspect server responses rather than client requests. For example, to view responses from an HTTPS server, use:
sudo tcpdump -i ens160 tcp src port 443
For DNS replies from a resolver, you might capture UDP packets sourced from port 53:
sudo tcpdump -i eth0 udp src port 53
DNS can use both UDP and TCP, especially for large responses or zone transfers, so a broader DNS capture might use port 53 without specifying only UDP: sudo tcpdump -i eth0 port 53.
Common service port examples
- SSH:
sudo tcpdump -i eth0 tcp port 22 - HTTP:
sudo tcpdump -i eth0 tcp port 80 - HTTPS:
sudo tcpdump -i eth0 tcp port 443 - DNS:
sudo tcpdump -i eth0 port 53 - SMTP:
sudo tcpdump -i eth0 tcp port 25 - PostgreSQL:
sudo tcpdump -i eth0 tcp port 5432 - MySQL:
sudo tcpdump -i eth0 tcp port 3306
When troubleshooting client-side connectivity, destination port filters usually show outbound attempts to a remote service: sudo tcpdump -i wlan0 tcp dst port 443. When troubleshooting server-side behavior, destination port filters show incoming requests, while source port filters show the replies leaving the server. To reduce name resolution delays and make output easier to scan, add -n so addresses and ports stay numeric: sudo tcpdump -n -i eth0 tcp port 443.
Do these 3 things before closing this tab:
1Scan for outdated or missing drivers - takes under a minute2Clear out junk files and repair common Windows errors3Fix the driver behind crashes, sound loss and screen glitchesCombining Host, Port, and Protocol Filters
After filtering by a single protocol or port, the next step is narrowing captures to the exact conversation you care about. Tcpdump supports Berkeley Packet Filter expressions, so you can combine host, src, dst, port, and protocol keywords such as tcp, udp, and icmp. This is especially useful on busy servers where capturing every packet would produce too much output and make troubleshooting harder.
A common pattern is to select an interface, disable name resolution for speed, and then apply a focused expression. For example, to watch HTTPS traffic between the local machine and a specific remote host, use:
sudo tcpdump -i eth0 -nn host 203.0.113.25 and tcp port 443
This command captures only TCP packets on port 443 where 203.0.113.25 is either the source or destination. The -nn option keeps tcpdump from resolving hostnames and service names, so IP addresses and numeric ports are shown exactly as seen on the wire.
Quick wins for a faster PC:
Repair Windows errors before they cause bigger problemsFix Now →Scan for outdated or missing drivers - takes under a minuteDriver Scan →Filtering by traffic direction
When you need to separate inbound and outbound traffic, use src and dst. To capture SSH connections coming from one client to a server, run:
sudo tcpdump -i eth0 -nn src host 198.51.100.10 and dst port 22 and tcp
To view responses from the server back to that client, reverse the direction:
sudo tcpdump -i eth0 -nn dst host 198.51.100.10 and src port 22 and tcp
Free tools Windows power users keep installed
One-click scans. No signup required.
This distinction helps when diagnosing firewall rules, asymmetric routing, or cases where a client sends packets but never receives replies.
Combining multiple conditions
Use and, or, and parentheses to build more precise filters. Parentheses often need quoting or escaping so the shell does not interpret them before tcpdump receives the expression. For example, to capture DNS traffic for one host over either UDP or TCP, use:
sudo tcpdump -i eth0 -nn host 192.0.2.50 and '(udp port 53 or tcp port 53)'
To capture web traffic from a client to either HTTP or HTTPS, use:
What’s actually slowing this PC down?
Pick the symptom - the matching free tool is one click away.
sudo tcpdump -i eth0 -nn src host 192.0.2.25 and tcp and '(dst port 80 or dst port 443)'
Rank #4
For a database troubleshooting case, you might capture only PostgreSQL traffic between an application server and a database server:
sudo tcpdump -i eth0 -nn host 10.10.1.20 and host 10.10.2.30 and tcp port 5432
Using two host clauses limits the capture to packets where both endpoints match, which is more precise than filtering on one host and one port alone.
Practical filter examples
- ICMP between two systems:
sudo tcpdump -i eth0 -nn icmp and host 10.0.0.5 and host 10.0.0.10 - NTP from a specific client:
sudo tcpdump -i eth0 -nn src host 10.0.0.25 and udp dst port 123 - SMTP to a mail server:
sudo tcpdump -i eth0 -nn dst host 10.0.1.15 and tcp port 25 - All traffic except SSH:
sudo tcpdump -i eth0 -nn host 192.0.2.40 and not port 22
For readable live troubleshooting, add options such as -v for more detail, -c to stop after a packet count, or -A to print ASCII payloads when inspecting clear-text protocols. For example, sudo tcpdump -i eth0 -nn -c 50 host 192.0.2.25 and tcp port 80 captures only the first 50 matching HTTP packets, which keeps the output manageable while confirming whether the expected traffic is present.
Saving Captures to PCAP Files
Displaying packets in the terminal is useful for quick checks, but many troubleshooting tasks require saving traffic for later review. With tcpdump, the -w option writes captured packets to a PCAP file instead of printing them to standard output. This preserves packet headers and payload data in a format that can be opened later with tcpdump, Wireshark, tshark, or other packet analysis tools.
A basic file capture uses the same filter syntax as live viewing. For example, to capture DNS traffic on interface eth0 and save it to a file, run:
sudo tcpdump -i eth0 -w dns-capture.pcap udp port 53
While this command is running, tcpdump may show only a short status line rather than packet details, because packets are being written directly to the file. Stop the capture with Ctrl+C. Tcpdump will then print capture statistics, including how many packets were captured, received by the filter, and dropped by the kernel.
Saving Common Troubleshooting Captures
PCAP output is especially helpful when you need to share evidence with another team, compare packet timing, inspect retransmissions, or review application behavior after an incident. The capture filter should be as specific as possible so the file stays small and focused.
- Capture HTTPS traffic to or from a host:
sudo tcpdump -i eth0 -w web-443.pcap host 203.0.113.10 and tcp port 443 - Capture SSH traffic from a client:
sudo tcpdump -i eth0 -w ssh-client.pcap src host 192.0.2.25 and tcp port 22 - Capture ICMP tests for ping troubleshooting:
sudo tcpdump -i eth0 -w icmp-test.pcap icmp - Capture all traffic between two systems:
sudo tcpdump -i eth0 -w host-to-host.pcap host 192.0.2.10 and host 198.51.100.20
On busy systems, unrestricted captures can grow quickly. Use -c to stop after a fixed number of packets. This is useful when reproducing a short issue, such as a failed connection attempt or a single DNS lookup.
sudo tcpdump -i eth0 -c 500 -w sample.pcap host 192.0.2.50 and tcp
For longer captures, use file rotation so tcpdump does not create one large file. The -C option rotates files by size in millions of bytes, and -W limits the number of files. The following command captures HTTP traffic, creates files up to about 100 MB each, and keeps five rotated files:
sudo tcpdump -i eth0 -w http-rotate.pcap -C 100 -W 5 tcp port 80
You can also rotate by time with -G, which specifies the interval in seconds. When using time-based rotation, include a time format in the filename so each file has a unique name.
Outdated Drivers Are Slowing You Down
One free scan finds every outdated or missing driver and matches the right update for your exact hardware.Free scan · exact hardware matchPC Slower Than It Used to Be?
A free scan shows the junk files, broken settings and background clutter dragging Windows down - then fixes them in one click.Free scan · Windows 10 & 11sudo tcpdump -i eth0 -G 300 -w 'capture-%Y%m%d-%H%M%S.pcap' tcp port 443
By default, tcpdump may capture only part of each packet depending on the snapshot length. To capture full packets, use -s 0. This is often preferred when saving PCAP files for detailed analysis because it avoids truncating payload data.
Best Value
sudo tcpdump -i eth0 -s 0 -w full-packets.pcap host 203.0.113.25
Store capture files carefully because they may contain sensitive data such as internal IP addresses, cookies, tokens, DNS queries, or unencrypted application payloads. Use targeted filters, restrict file permissions, and remove captures when they are no longer needed.
Reading and Analyzing Saved Capture Files
After writing traffic to a PCAP file with -w, you can inspect it later with -r. This is useful when captures are collected on a production server but analyzed elsewhere, or when you want to avoid interpreting packets in real time during an incident. The basic syntax is simple: tcpdump -r capture.pcap. By default, tcpdump prints a packet for every frame in the file, using the same style of output you see during a live capture.
You can apply the same Berkeley Packet Filter expressions when reading a file as you do when capturing from an interface. For example, to display only DNS traffic from a saved capture, run tcpdump -r capture.pcap udp port 53. To inspect HTTPS traffic involving a specific host, use tcpdump -r capture.pcap host 192.0.2.25 and tcp port 443. If the file contains a large amount of traffic, filtering during readback helps you focus on the packets related to a service, endpoint, or failure window.
Common readback commands
tcpdump -r web-issue.pcapreads and displays all packets from the file.tcpdump -nn -r web-issue.pcapdisables hostname and service-name lookups, keeping output fast and unambiguous.tcpdump -tttt -r web-issue.pcapprints full human-readable timestamps for timeline analysis.tcpdump -r web-issue.pcap tcp port 80 or tcp port 443shows HTTP and HTTPS packets only.tcpdump -r dns.pcap -vvv udp port 53increases verbosity for DNS troubleshooting.tcpdump -r capture.pcap 'src host 10.0.0.5 and dst port 443'shows connections from one client to a secure service.
For deeper inspection, increase verbosity with -v, -vv, or -vvv. These options expose more protocol details, such as TTL values, TCP options, ICMP fields, and DNS record data. To view packet payloads in hexadecimal and ASCII, use -X: tcpdump -nn -X -r app-traffic.pcap tcp port 8080. For hexadecimal only, use -x. Payload output is most useful for clear-text protocols such as HTTP, SMTP, or some custom application protocols; encrypted traffic such as TLS usually reveals metadata like IPs, ports, packet sizes, and timing rather than readable content.
Saved captures can also be trimmed into smaller files for sharing or focused analysis. Use -r to read the original file and -w to write only matching packets into a new PCAP. For example, tcpdump -r full-capture.pcap -w dns-only.pcap udp port 53 extracts DNS traffic, while tcpdump -r full-capture.pcap -w client-443.pcap 'host 10.1.2.50 and tcp port 443' isolates HTTPS sessions for one client. This approach keeps the original evidence intact while producing a smaller file that can be opened in tcpdump, Wireshark, tshark, or other packet analysis tools.
Frequently Asked Questions
How do I capture traffic on a specific port with tcpdump?
Use the port filter followed by the port number, such as sudo tcpdump -i eth0 port 443 to capture HTTPS traffic. If you only want traffic going to or from one direction, use src port 443 or dst port 443.
How can I save a tcpdump capture so I can open it later in Wireshark?
Use the -w option to write packets to a PCAP file, for example sudo tcpdump -i eth0 -w capture.pcap port 53. The file can later be opened in Wireshark or read with tcpdump using tcpdump -r capture.pcap.
How do I capture traffic for one host and one protocol only?
Combine filters with and, such as sudo tcpdump -i eth0 host 192.168.1.50 and tcp. You can be more specific by using src host or dst host if you only want packets sent by or sent to that host.
Why am I not seeing any packets when I run tcpdump?
Check that you are listening on the correct interface with ip link or tcpdump -D, then specify it with -i. Also make sure your filter is not too restrictive and that you have permission to capture packets, usually by running tcpdump with sudo.
How do I limit tcpdump output so it does not run forever or create a huge file?
Use -c to stop after a specific number of packets, such as sudo tcpdump -i eth0 -c 1000 -w sample.pcap. You can also rotate capture files by size with -C and by count with -W, for example tcpdump -i eth0 -C 100 -W 5 -w traffic.pcap.
Bottom Line
tcpdump is one of the most useful tools for quickly inspecting network traffic from the command line, whether you need to filter by protocol, port, host, interface, or packet direction. With the right expressions, you can narrow noisy traffic down to the exact connection or service you need to troubleshoot.
Quick wins for a faster PC:
Scan for outdated or missing drivers - takes under a minuteDriver Scan →Clear out junk files and repair common Windows errorsFree Scan →Fix the driver behind crashes, sound loss and screen glitchesFind Drivers →Use live captures for immediate diagnosis, and write packets to a .pcap file when you need deeper analysis in tools like Wireshark or want to share evidence with another team. Start with a focused filter, capture only what you need, and refine the command as the traffic pattern becomes clearer.
Quick Recap
Product prices and availability are accurate as of the date/time indicated and are subject to change. Any price and availability information displayed on Amazon at the time of purchase will apply.




