On published GPU specifications, Xbox Series X has the higher raw figure; that does not make it the universal winner in games. Microsoft lists its GPU at 12 TFLOPS, while Sony lists the original PS5 GPU at up to 10.3 TFLOPS. Those manufacturer figures are not game benchmarks. Actual performance depends on the specific title, patch, graphics mode, and scene, so compare the same game on both consoles rather than treating one spec as a verdict.
What the published specifications say
The specifications below are manufacturer figures published in 2020 for Xbox Series X and the original PS5. They describe hardware and supported features, not results from a controlled comparison of games.
As an Amazon Associate I earn from qualifying purchases.
| Specification | Xbox Series X | Original PS5 |
|---|---|---|
| GPU | Custom RDNA 2 GPU, 12 TFLOPS (Microsoft, 2020) | RDNA 2-based GPU, variable frequency up to 2.23 GHz and up to 10.3 TFLOPS (Sony Interactive Entertainment, 2020) |
| CPU | Custom 8-core Zen 2 | 8-core/16-thread Zen 2 |
| Memory | 16 GB GDDR6 | 16 GB GDDR6 |
| Internal SSD | 1 TB | 825 GB |
| Published performance and display statements | 4K at 60 FPS target; support up to 120 FPS | Support for 4K 120 Hz TVs, 8K TVs, and HDMI 2.1 VRR |
Sources: Microsoft’s Xbox Series X specifications and Sony’s original PS5 technical specifications. Microsoft defines TFLOPS as a measure of a GPU’s raw mathematical performance; it is not a direct measure of a game’s frame rate or image quality. The Xbox figure is higher on paper, but developers, game engines, render settings, and platform-specific optimization affect what players see.
Why TFLOPS cannot decide which console runs games better
TFLOPS summarizes a narrow aspect of GPU capability. It does not account for every part of rendering a game, how a particular engine uses each console, or the quality and stability of a graphics mode. Nor does it tell you whether a game uses native, dynamic, or reconstructed resolution, or how smoothly it maintains a frame-rate target in demanding scenes.
#1 Best Overall

- Model Number CFI-2000
- Includes DualSense Wireless Controller, 1TB SSD, 2 Horizontal Stand Feet, HDMI Cable, AC power cord, USB cable, printed materials, ASTRO’s PLAYROOM (Pre-installed game)
- Vertical Stand sold seperately
Both consoles support hardware-accelerated ray tracing, but the effects and their performance costs vary by game and implementation. Sony notes that developers can use PS5 ray-tracing hardware in different ways. Compare the actual effects and the associated resolution or frame-rate tradeoffs in the title you play, not the feature name alone. Sony’s PS5 FAQ and Microsoft’s specifications describe platform capabilities, not a guarantee of identical results across games.
How to compare game performance fairly
Use the same game on both consoles and match the patch, graphics mode, and gameplay scene as closely as possible. A performance mode on one console is not an apples-to-apples comparison with a quality or ray-tracing mode on the other. Distinguish the game’s advertised target from measured behavior.
Rank #2
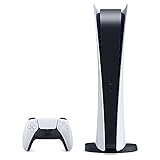
- CPU: x86-64-AMD Ryzen Zen 8 Cores / 16 Threads at 3.5GHz.GPU: AMD Radeon RDNA 2-based graphics engine.
- 16GB GDDR6/256-bit Memory; 825GB SSD Storage Capacity
- Ethernet (10BASE-T, 100BASE-TX, 1000BASE-T), IEEE 802.11 a/b/g/n/ac/ax, Bluetooth 5.1
- HDR technology, 8K output, 4K TV gaming, Up to 120 fps with 120Hz output, Tempest 3D AudioTech
- What's Included: Sony PlayStation 5 Disc Version; Wireless controller; USB cable, HDMI cable, AC power cord. Nogtox PVT HDMI_cable
- Identify the versions: Record each console, game version or patch, and graphics mode.
- Match the test: Compare the same scene or sequence, and note any platform-specific mode differences.
- Check frame rate and pacing: Look for dips below the target, uneven frame delivery, and responsiveness, not just a peak or headline FPS number.
- Assess image quality: Note resolution behavior—native, dynamic, or reconstructed if established—and how clear the image remains in motion.
- Compare visual effects and loading: Check which ray-tracing effects are present and compare loading in the same game and scenario. SSD capacity or a console’s feature list alone cannot establish which loads a particular game faster.
- Account for the display: Confirm that the TV or monitor supports the refresh rate and relevant connection features, and that the game offers the mode. Console support for 120 FPS or 4K 120 Hz is not a promise that every game runs at that combination.
Digital Foundry’s February 2023 comparison of one game across PS5 and Xbox Series X/S discusses visual settings, ray tracing, and performance, and notes that changes to the game’s code required repeated analysis. It illustrates why patch context matters; it is not a current, platform-wide benchmark or a verdict for other games.
Is Xbox Series X more powerful than PS5?
By the published raw GPU TFLOPS figures, Xbox Series X is higher: 12 TFLOPS versus up to 10.3 TFLOPS for the original PS5. That supports a limited hardware-spec comparison, not a blanket conclusion that Xbox runs every game better. The cited specifications date to 2020, and the PS5 figure refers to the original model; hardware revisions and storage capacities can differ.
Rank #3

- 🚀 CPU: 3.5GHz, 8-core AMD Zen 2
- 🚀 Storage: Custom 825GB SSD
- 🚀 RAM: 16GB GDDR6
- 🚀 GPU: 10.3 teraflop RDNA 2 GPU
Which is better for 4K and 120 FPS?
Both consoles advertise support relevant to high-resolution or high-refresh-rate play, but support is not the same as a game-level guarantee. Microsoft’s Series X specification sets out a 4K-at-60-FPS performance target and support up to 120 FPS. Sony lists support for 4K 120 Hz TVs. Whether a particular game reaches 4K, maintains 120 FPS, or offers a mode combining them depends on that title and its settings. Your display must also support the necessary refresh rate and connection features.
Which console should you choose for performance?
There is no established current, representative multi-game benchmark here that proves a universal performance winner. Choose based on the games you actually play, your preferred platform, and comparable results for those specific titles. When performance is decisive, look for testing that names the game patch, mode, and scene and examines stability and image quality—not just the consoles’ TFLOPS figures.
Quick Recap
Product prices and availability are accurate as of the date/time indicated and are subject to change. Any price and availability information displayed on Amazon at the time of purchase will apply.
Recommended Free Tools




