Recommended Free Tools
Mecropolis combines farm records with a weather-based crop-stage workflow: it accumulates growing degree days (GDD) from planting and advances a season when its configured crop threshold is crossed. The project creator says those thresholds are personal estimates without cited sources, so the stages should be read as an app feature—not as validated agronomic guidance.
How Mecropolis uses past weather to track a season
In the workflow described by creator C W, a farm manager plans a crop season and records its planting date. Mecropolis then sums GDD using temperatures from Open-Meteo beginning on that date. When the running total crosses the threshold assigned to the crop, the app advances the season stage automatically.
| # | Preview | Product | Price | |
|---|---|---|---|---|
| 1 |

|
Ambient Weather WS-2902 Wi-Fi Smart Weather Station | $199.99 | Buy on Amazon |
| 2 |
|
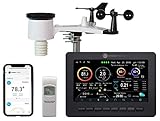
Ambient Weather WS-2000 Smart Weather Station | $299.99 | Buy on Amazon |
| 3 |

|
4M Green Science Weather Science Kit - DIY Mini Observatory & STEAM Toy | $16.99 | Buy on Amazon |
| 4 |

|
Weather Meter Kit | $79.95 | Buy on Amazon |
| 5 |
|
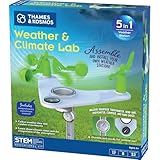
T&K Weather & Climate Lab | Earth Science Experiment Set | $20.95 | Buy on Amazon |
As an Amazon Associate I earn from qualifying purchases.
The described season path runs through planned, planted, growing, pre-harvest, harvested, and review. This makes weather accumulation one input to a field log rather than a replacement for records entered by the people managing the farm.
What’s actually slowing this PC down?
Pick the symptom - the matching free tool is one click away.
What the field tracker brings together
The project is intended for farm managers and agronomists who want field activity and weather in one place. Its linked records include farms, fields, crops, seasons, observations, treatments, pest reports, and weather snapshots. The creator reports these features:
#1 Best Overall
- COMPLETE WEATHER STATION: (1) Osprey Sensor Array with Rain Cup, and (1) Brilliant, Easy-to-Read LCD Color Display
- AUTHENTIC HYPER-LOCAL DATA: Monitor your actual home and backyard weather conditions with our wireless and Wi-Fi-enabled sensor array measuring wind speed/direction, temperature, humidity, rainfall, UV intensity, and solar radiation
- SMART HOME READY: Set up alerts, access your data remotely, and program your home based on weather conditions using IFTT, Google Home, Alexa, and more
- ENHANCED WIFI: Enables your station to transmit its data wirelessly to the world's largest personal weather station network (optional setting)
- JOIN THE COMMUNITY: Connect to Ambient Weather Network to customize your dashboard tiles, share hyperlocal weather conditions via social feeds and create your own forecasts (coming soon)
- A farm and field map, dashboard, and season comparisons.
- Dated notes with revision history, photos, soil-test PDFs, and CSV export.
- A GDD chart and a rainfall-and-temperature what-if scenario.
- Semantic search and an AI-generated summary of stored records.
The creator says weather and soil information come from live APIs, while operators enter treatments and yields. Regional yield benchmarks are shown separately rather than used to fill in a field’s yield. The submission does not identify every provider behind the weather and soil panels.
Why the crop stages need a clear caveat
C W writes: “The crop model parameters are my own hand-written estimates. They have no cited source, and the app confirms it.” That limits what can be inferred from an automatic stage change: the described mechanism is clear, but the threshold values are not established as authoritative or independently validated. A stage label should not be treated as a recommendation about when to irrigate, treat, or harvest.
Rank #2
- Allows you to monitor your home and backyard weather conditions with TFT color display
- Wireless all-in-one integrated sensor array measures wind speed/direction, temperature, humidity, rainfall, UV and solar radiation
- Supports both imperial and metric units of measure with calibration available
- Enhanced Wi-Fi connectability option that enables your station to transmit its data wirelessly to the world's largest personal weather station network
- Console power provided by 5V DC adapter (included), and sensor array requires 3 x AAA batteries (not included)
Automation, recommendations, and human review
According to the creator, new observation, treatment, and weather records trigger a document function that reconciles accumulated GDD and configured thresholds. A scheduled function also runs daily at 02:00 UTC. Stage updates are described as revision-guarded transactions, intended to avoid overwriting a newer record.
The system can propose recommendations with supporting season evidence, but the project describes a review flow in which a person accepts or rejects them. That separates an automated prompt from a farm decision; the submission does not establish that proposed recommendations are agronomically validated.
Rank #3
- STATIC ELECTRICITY & LIGHTNING FORMATION: Discover the power of static electricity by making hair stand on end and bending water with a charged balloon. Simulate lightning just like in real storm clouds.
- CLOUD FORMATION & EVAPORATION SCIENCE: Use an air pump to create instant clouds in your palm and watch them disappear as they "evaporate." This activity demonstrates the processes of condensation and evaporation.
- GREENHOUSE EFFECT: Trap heat using CO2 produced from baking soda and vinegar in this hands-on demo of the greenhouse effect. See firsthand how global warming works and understand its impact on Earth's climate.
- WATER CYCLE & ECOSYSTEM IN ACTION: Build a desktop water cycle model featuring a cloud-covered mountain. Watch as rain forms and grows a bean plant in a self-contained ecosystem—a practical demonstration of the water cycle.
- WIND CONVECTION: Conduct eco-experiments like testing the harmful effects of acid rain on plants using vinegar. Explore wind convection by observing warm air rise and spin a paper spiral, simulating real wind patterns.
Where the demo is based
The demo farm is set in South Africa’s Western Cape, in the Swartland wheat belt. The creator says the data model is not tied to that region. That is the project author’s account, not independent verification of operation in other locations or of the demo’s current availability.
How the project is built
The final version is described as a Vite, React, and TypeScript single-page app hosted on Cloudflare Pages, with Sanity as its content backend. The browser reads a public-read dataset; writes are routed through a Pages Function that holds the write token and applies session and validation controls. The author also describes a shared demo account and global hourly caps on public writes. These are implementation details reported by the creator, not a security audit or guarantee.
Rank #4
- Kit represents the three core components of weather measurement: wind speed, wind direction and rainfall.
- It uses sealed magnetic reed switches and magnets so you'll need to source a voltage to take any measurements.
- All of the sensors in the weather meter kit are passive components. This means you will need a voltage source in order to measure anything with them.
- Sensors include Wind vane, Cup anemometer, Tipping bucket rain gauge. RJ11 terminated cables.
- Stand: Two-part mounting mast, Rain gauge mounting arm, Wind meter mounting bar, 2x Mounting clamps and 4x Zip ties.
C W recounts moving away from an earlier Next.js, Sanity Studio, Auth.js, and Vercel design after rendering and deployment problems, and then replacing Sanity App SDK sign-in with a signed session cookie. The implementation account illustrates project-specific adjustments; it does not establish that the final deployment has been independently reviewed.
The creator reports 313 repository tests and CI checks for type checking, linting, tests, build, and an npm audit kept at zero. The author also says the regional map accumulates increments to avoid refetching 187 weather points per visit. These figures and quality claims are self-reported in the project submission, not independently verified.
Best Value
- This compact, 5-in-1 weather station provides the tools to investigate specific weather phenomena and Earth’s climate system in general.
- Efficient design includes a durable stake to secure the weather station into the ground or to a pole outside for real-time measurements.
- Built-in tools include: wind vane, compass, rain gauge, anemometer (wind speed indicator), and thermometer to monitor, observe, and record weather data.
- The 32-page, full-color manual guides young scientists through hands-on experiments to investigate a variety of topics including air pressure and temperature, the water cycle, the atmosphere, wind, and more.
- Encourages and develops observation and note-taking skills while promoting a sense of responsibility for our planet, nature, and the environment.
What the project does—and does not—establish
Mecropolis presents a practical combination: field observations and treatments remain operator-entered, while weather accumulation can move a season through configured stages and keep those records together. Its model is most useful to understand as a workflow prototype or project implementation, not as proof that a particular crop will reach a stage at a particular time. The creator’s stated lack of sourced thresholds is especially important for anyone considering the stage labels or recommendation flow for real farm decisions.
Source: C W, “Mecropolis: Tracking Crop Stages from Past Weather,” DEV Community, September 26, 2026.
Quick Recap
Product prices and availability are accurate as of the date/time indicated and are subject to change. Any price and availability information displayed on Amazon at the time of purchase will apply.




