Learning data structures and algorithms can feel tedious when it means memorizing definitions and code. Make each idea something you can test: predict the next step, trace a small input, explain why the step works, implement it, and check edge cases. Visualizations can make intermediate changes easier to see, but they complement—not replace—coding and efficiency analysis.
How to make DSA study more active
Start with a question rather than a definition. Work through a small example by hand, say what you expect to happen next, and only then reveal the next step. After tracing, write an implementation and test cases that could expose a mistaken assumption.



As an Amazon Associate I earn from qualifying purchases.
- Predict: What should the algorithm do next, and why?
- Trace: Record the relevant values or range after each step.
- Explain: State the condition that makes the step valid.
- Implement: Translate the reasoning into code in your language.
- Test: Try ordinary inputs and boundary cases, then consider time growth and extra memory.
An animation can help you inspect changing state. It cannot, on its own, establish that you understand the invariant, can implement the method, or know when its assumptions apply. A 2014 paper on algorithm visualization discusses visualization as an educational aid; it is background on the approach, not evidence that any particular current tool guarantees better results (Kaninda Musumbu, “Algorithms Visualization Tool for Students and Lectures in Computer Science”).
Three examples that teach different ideas
Two Sum: compare ways to find a pair
Given a list of numbers and a target, find two values whose sum equals that target. For a short list, first try checking pairs directly: choose one value, compare it with each later value, and see whether the pair reaches the target. This straightforward strategy is easy to trace, but the number of comparisons can grow quadratically as the list gets longer.
#1 Best Overall
Then ask what information would avoid repeatedly checking pairs. A hash table can store values already seen and support a lookup for the complement: for the current value x, check whether target - x has appeared. This trades additional memory for faster lookup on average. Pay attention to details such as whether the same array element may be used twice; in the usual distinct-index interpretation, only previously seen values can form the pair with the current one.
Two Sum is a problem, not a single mandated implementation. The useful learning move is to compare the simple approach with a data-structure-assisted one, including their assumptions, memory use, and performance. A visualizer can help show the changing state, while writing the code forces you to handle details such as duplicate values and missing solutions.
Rank #2

- color: White
- INTRODUCTION TO ALGORITHMS, FOURTH EDITION
Binary search: see why sorted order matters
Binary search requires sorted input. Compare the target with the middle value; if they differ, sorted order tells you which half cannot contain the target. Keep only the remaining half and repeat. At every step, write down the current range and the reason the discarded values are impossible.
The Tool Desk
Outbyte Driver Updater FREEFix the driver behind crashes, sound loss and screen glitchesFind Drivers →Outbyte PC Repair FREERepair Windows errors before they cause bigger problemsFix Now →That shrinking range is the core idea, not merely the mechanics of calculating a midpoint. If the input is not sorted, the comparison does not justify discarding half the data. Binary search can reduce the search range in logarithmic time, whereas a linear scan may need to inspect every item; the right comparison also accounts for the cost of sorting if the data is not already ordered.
Rank #3
Bubble sort: make comparisons and swaps visible
Bubble sort repeatedly compares adjacent values and swaps them when they are out of order. In a left-to-right pass, the largest value among the unsorted portion reaches its end. Trace one pass and ask what has become true about that final position; then repeat on the remaining unsorted portion.
Its clear sequence of comparisons and swaps makes bubble sort useful for seeing how a sorting process changes an array. It is generally inefficient for large practical workloads: its repeated passes can require quadratic work. Treat it as a teaching example, not a default choice for sorting large datasets.
Independent reader supportYour contribution helps us test, update, and keep practical guides available for everyone.Choosing a learning format
Interactive tracing and a book serve different needs. Consider whether you learn better by stepping through changing state or by reading explanations, whether examples use a language you know, whether exercises include solutions, how much prerequisite knowledge is assumed, and whether the material explains correctness and efficiency as well as steps.
Outdated Drivers Are Slowing You Down
One free scan finds every outdated or missing driver and matches the right update for your exact hardware.Free scan · exact hardware matchWindows Errors? Fix Them Before They Spread
Repair common Windows errors and clear accumulated junk for a smoother, more stable PC - no reinstall needed.Free scan · no reinstall| Resource | Format and access | Coverage and language | Published details |
|---|---|---|---|
| DSA Visualization | Its site describes free interactive lessons without account signup, where learners can predict, step through, and experiment with algorithm decisions. | Its paths separate Foundations, Sorting and Searching, and Interview Patterns. The site lists 46 visualizers. | The site estimates about 30 minutes for Foundations, 35 minutes for Sorting and Searching, and 50 minutes for Interview Patterns. These are vendor-provided estimates, not independently measured completion times. |
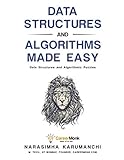
| A Common-Sense Guide to Data Structures and Algorithms, Second Edition, by Jay Wengrow | The Pragmatic Bookshelf lists the book as in print and says every chapter includes exercises. | The publisher describes examples in JavaScript, Python, and Ruby; the contents include hash tables, binary search, and bubble sort. | The publisher lists 506 pages, an August 2020 publication date, and ISBN 9781680507225. |
These figures describe what each provider says it offers; they are not a head-to-head quality ranking. The book is an optional way to get structured explanations and exercises alongside interactive practice, not a requirement for learning the concepts.
Best Value
- Binding: paperback
- Language: english
- It ensures you get the best usage for a longer period
How to tell whether you understand an algorithm
- You can name the input condition it relies on, such as sorted order for binary search.
- You can explain why a step preserves the possibility of reaching a correct answer.
- You can trace a small example without relying on the animation to make decisions for you.
- You can implement the method and test edge cases, including empty input, duplicates, and absent targets where relevant.
- You can describe the trade-off: time growth, extra memory, and the cost of preparing the input.
DSA Visualization describes its aim as: “The goal is not more animation. It is a clearer connection between each decision, the data it changes, and the code that caused it.” That is the provider’s description of its educational approach, not an independent finding about learning outcomes.
Quick Recap
Product prices and availability are accurate as of the date/time indicated and are subject to change. Any price and availability information displayed on Amazon at the time of purchase will apply.




