Quick wins for a faster PC:
Scan for outdated or missing drivers - takes under a minuteDriver Scan →Clear out junk files and repair common Windows errorsFree Scan →The “Resource Limit Is Reached” message usually means your hosting account—not WordPress itself—has exceeded a CloudLinux resource allowance. On many shared hosts, that appears as HTTP 508 when the account has no available concurrent entry process for a new web request. The reliable fix is to identify which limit was exhausted, reduce the workload that consumed it, and increase that specific limit only when the demand is legitimate and recurring.
Antihost offers managed WordPress hosting with free migration, one-click staging and a 14-day free trial.
Do not start by changing random PHP settings or buying a larger plan. Capture the event, check Resource Usage or the host’s CloudLinux panel, and match the remedy to the measured fault: entry processes, CPU, memory, I/O, total processes, or inodes.
As an Amazon Associate I earn from qualifying purchases.
Windows Errors? Fix Them Before They Spread
Repair common Windows errors and clear accumulated junk for a smoother, more stable PC - no reinstall needed.Free scan · no reinstallOutdated Drivers Are Slowing You Down
One free scan finds every outdated or missing driver and matches the right update for your exact hardware.Free scan · exact hardware matchWhat “Resource Limit Is Reached” means
WordPress does not define one universal “resource limit” error. The wording is commonly generated by a hosting environment that uses CloudLinux Lightweight Virtual Environment (LVE) controls. LVE assigns each hosting account separate quotas so one customer cannot consume all of a shared server’s capacity.
Those quotas can cover CPU time, physical or virtual memory, disk I/O, total processes, concurrent entry processes, and inodes. The account can therefore be healthy in one category and over its allowance in another. A site that has plenty of storage, for example, may still return an error because too many PHP requests are running at once.
#1 Best Overall

- [Color] PCB color may vary (black or green) depending on production batch. Quality and performance remain consistent across all Timetec products.
- DDR3L / DDR3 1600MHz PC3L-12800 / PC3-12800 240-Pin Unbuffered Non-ECC 1.35V / 1.5V CL11 Dual Rank 2Rx8 based 512x8
- Module Size: 16GB KIT(2x8GB Modules) Package: 2x8GB ; JEDEC standard 1.35V, this is a dual voltage piece and can operate at 1.35V or 1.5V
- For DDR3 Desktop Compatible with Intel and AMD CPU, Not for Laptop
- Guaranteed Lifetime warranty from Purchase Date and Free technical support based on United States
Why the page says HTTP 508
HTTP 508 is especially associated with the concurrent entry-process limit. An entry process is the request currently being handled by the account, such as a PHP request for a WordPress page. If every available entry slot is occupied, Apache cannot place another request inside the account’s LVE and CloudLinux returns 508.
High traffic is one possible trigger, but it is not the only one. Poorly optimized pages with many simultaneous requests, web crawlers, large imports or exports, backups, image processing, and scheduled jobs can all keep requests active long enough to exhaust the allowance.
Other limits can fail differently
| Limit | What consumes it | Typical result or clue |
|---|---|---|
| Concurrent entry processes | Simultaneous web requests waiting or running in the account | HTTP 508; new requests cannot enter the LVE |
| CPU | PHP execution, database work, image or feed processing, and other computation | Requests generally become slower; the resource graph shows CPU faults |
| I/O | Reading and writing files, databases, backups, caches, and media | Slower responses and I/O faults during heavy disk activity |
| Physical or virtual memory | PHP workers, page builders, imports, backups, and plugins that allocate large amounts of memory | Memory-related failures; WordPress or PHP may show a 500 or 503 response |
| Total processes | Workers and other processes created by PHP, cron jobs, or account tasks | Process faults; new workers may fail to start |
| Inodes | Every file and directory, including caches, logs, backups, and staging copies | File-creation or storage operations fail even when reported disk space remains |
The exact response depends on the control that was reached. CPU or I/O pressure often manifests as slow pages, while memory or process exhaustion can produce 500 or 503 errors instead of 508. Treat the status code as a clue, not proof of the underlying limit.
What to do during an active incident
Capture evidence before changing anything
Write down the exact time, affected URL, action that preceded the failure, and complete error text. Note whether the problem affects every page, only the front end, only the dashboard, or one operation such as an import. An intermittent error is much easier for a host to match to usage graphs when it has a timestamp in the account’s time zone.
- Save a browser screenshot or copy the complete server response.
- Record whether visitors, logged-in editors, an API client, or a scheduled task triggered the request.
- Note any traffic campaign, product launch, content release, backup, migration, plugin change, theme change, or WordPress update that occurred near the first failure.
- Avoid repeatedly refreshing the failing URL; each attempt can add another request while the account is already constrained.
Use a temporary containment measure
If the site is receiving an obvious traffic spike, pause nonessential imports, exports, backups, image conversions, and feed-generation jobs until you know which limit is faulting. Do not delete files, disable security controls, or raise PHP memory values blindly. Those actions can remove evidence or leave the real quota unchanged.
How to identify the exhausted resource
Check cPanel or the host dashboard
- Sign in to the hosting control panel.
- Open Resource Usage, Resource Usage > Current Usage, or the equivalent CloudLinux usage view. Hosts use slightly different labels, but the panel should expose historical graphs and fault counters.
- Set the time range to include the incident. Compare the timestamp you recorded with spikes in entry processes, CPU, memory, I/O, processes, and inodes.
- Look for a fault counter or graph that rises at the same time. The first category that reaches its account limit is more useful than the generic phrase shown in the browser.
- Save a screenshot or export of the graph so support can review the same interval.
A normal-looking current graph does not disprove an earlier fault. Many panels display present usage separately from historical faults, so inspect the period containing the error.
Rank #2

- Office Gaming Mini PC - UPGRADED GMKtec Nucbox M5 Ultra Series is equipped with the powerful AMD Ryzen 7 7730U processor, 8 Cores/16 Threads, Base 2.00GHz (Power Saving Quiet Mode) with Turbo Boost up to 4.50GHz (Performance Mode) in BIOS settings, Based on the ZEN 3+ architecture, this small but powerful mini pc delivers satisfying results in productivity, office work, and gaming. 35% Performance increase over AMD Ryzen 5 7430U/ Ryzen 7 5700U, 5600U, 5560U, 5500U.
- 16GB DDR4 RAM & 256GB PCIe SSD - Installed with DDR4 16GB RAM (1x16GB), the Nucbox M5 Ultra mini pc support expansion to 64GB RAM. Featured with 256GB M.2 2280 PCIe 3.0 SSD, support dual slot expansion to 4TB SSD. (Upgrades not included)
- DUAL NIC LAN 2.5G RJ45 - Fast Network Speeds: Enjoy up to 2500Mbps data transmission speed without worrying about lagging. Ideal for working, gaming, and surfing the internet. Great for Untangle, Pfsense or as a server office PC.
- Mini Desktop Computer with 4K Triple Screen Display - Nucbox M5 Ultra integrates AMD Radeon Graphics 8 Cores 2000 MHz GPU to deliver powerful graphics processing power to easily handle the demands of complex design software, 4K@60Hz UHD video editing, and playback. It can connect to 3 display screens simultaneously.
- Fast Internet WiFi 6E + BT5.2 Connection - GMKtec Mini PC with WiFi-6E Wireless, have 2.5G/5G/6G triple band, more faster and lower latency. Bluetooth 5.2 allowing you more quickly to connect other wireless devices (headset, mouse, keyboard, etc.) Interface features 2*USB3.2 ports, 2*USB2.0 ports, 1*HDMI 2.0 port(4K@60Hz), 1*USB-C port(PD/DP/DATA), 1*DP Port, 1*Audio 3.5mm (HP&MIC), 1*DC Power Port.
Ask the host for account-level fault details
Send support the timestamp, URL, status code, and the limit identified in Resource Usage. Ask for the account’s LVE fault details rather than a generic statement that “the server was busy.” If the provider operates CloudLinux, an administrator can inspect entry-process faults with lveinfo --period=1d --by-fault=mep --display-username and observe current account activity with lvetop. These commands require server access; they are not commands to run in a normal WordPress dashboard.
Correlate the fault with the workload
Once you know the category, compare the same time window with access logs, analytics, crawler activity, WordPress cron jobs, backups, imports, exports, image processing, and recent plugin or theme changes. The purpose is to distinguish a traffic-driven spike from a job-driven one:
- Traffic-driven: many visitors or bots arrive together, and anonymous page requests remain active.
- Job-driven: a backup, migration, feed, image, or scheduled task starts at repeatable times and consumes resources even when traffic is ordinary.
- Code-driven: one plugin, theme component, query, or endpoint creates slow or unusually numerous requests after a change.
Fixes for concurrent entry-process faults
Entry-process faults mean that too many requests are active at once or that each request remains active for too long. The objective is to reduce simultaneous PHP work and shorten the time each request occupies an entry slot.
Serve cacheable pages without starting PHP
Enable a correctly configured full-page cache for logged-out, anonymous pages. A cache hit can be served without launching a fresh WordPress PHP request, reducing the number of entry processes needed during a traffic burst. Test the result while logged out and verify that pages containing personal or shopping data are excluded from the public cache.
Do not assume that a cache switch is working because a plugin reports “enabled.” Check response behavior and the cache status exposed by your host or caching layer. Purge and warm the cache after major content or configuration changes according to the cache system’s instructions.
Control crawler and abusive bot traffic
Review access logs and analytics for crawlers requesting the same expensive URLs repeatedly. Rate-limit or block abusive agents at the CDN, web server, or host level where possible. Keep legitimate search and service crawlers distinguishable from aggressive or malformed traffic; blocking all bots can create indexing and monitoring problems.
Rank #3
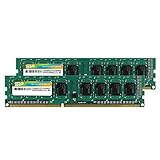
- Efficient performance: A lower voltage of 1.35 V is applied to reduce 20% power, enabling to effectively decrease hardware power consumption.
- System upgrade: With our high quality memory module, ideal for virtualization, cloud computing and multitasks handling, 100% factory-tested for stability, durability and compatibility.
- Durability Armed: 100% factory-tested to make sure the high stability, durability and compatibility.
- Compatibility is imperative: Compatible with major DDR3L / DDR3 motherboards.
- 【NOTE】The DDR3L UDIMM is backed by a lifetime warranty to promise complete services and technical support.
Reduce slow and concurrent WordPress work
- Inspect slow-request and database-query logs for endpoints that hold PHP workers open.
- Remove, replace, or reconfigure the plugin responsible for expensive recurring work, using a staging copy when the change could affect the site.
- Stagger backups, imports, exports, image processing, and feed generation instead of running them together.
- Move large administrative jobs to quiet periods and break very large batches into smaller ones when the tool supports it.
- Review scheduled tasks and avoid launching duplicate jobs after a timeout or browser refresh.
Raising the entry-process allowance can help a genuinely busy site, but it will not make a slow query efficient. If each request remains active for a long time, more entry slots can simply allow more expensive work to run concurrently.
Fixes for CPU or I/O faults
When CPU is the limiting factor
Use the CPU graph and slow-request or query logs to identify what is executing. Common evidence includes frequent image or feed processing, expensive database operations, repeated uncached page generation, or a plugin that performs substantial work on every request.
The Tool Desk
Outbyte PC Repair FREEClear out junk files and repair common Windows errorsFree Scan →Outbyte Driver Updater FREEFix the driver behind crashes, sound loss and screen glitchesFind Drivers →- Identify the URL, task, or extension whose activity overlaps the CPU fault.
- Reduce its frequency, batch size, or concurrency.
- Enable page and object caching where appropriate so repeated requests do not repeat the same computation.
- Replace or reconfigure the responsible plugin or theme component after testing the change.
- If the workload is expected and cannot be reduced, ask the host for more CPU capacity rather than changing an unrelated quota.
When I/O is the limiting factor
I/O faults indicate heavy reading or writing. Backups, large imports, cache rebuilds, log growth, media operations, and database activity can all create disk pressure. Schedule these jobs away from traffic peaks, reduce how much data each run processes, and remove redundant work. A resource graph that shows I/O faults at the same time as a backup is stronger evidence than a general complaint that pages feel slow.
Fixes for memory or process faults
Memory and total-process quotas are separate from PHP’s memory_limit setting. Increasing PHP’s per-script value cannot raise the CloudLinux account quota, and it can make an already constrained account attempt larger allocations.
Investigate memory pressure
- Check PHP error logs for fatal memory messages and note the script or endpoint named.
- Review large imports, backup tasks, page builders, image operations, and plugins that create many workers.
- Reduce batch sizes and parallel workers where the relevant tool permits it.
- Disable or reconfigure the responsible workload in a controlled environment, then repeat the operation while watching Resource Usage.
- Ask the host whether the account’s physical-memory allowance matches the site’s normal workload.
Investigate total-process pressure
If the process counter faults while entry processes are normal, look for tasks that spawn many workers or leave processes running. Scheduled jobs, command-line tasks, PHP workers, and backup utilities can contribute. The host can confirm which process type is being counted and whether the account is reaching its process ceiling.
Fixes for inode or storage exhaustion
An inode limit counts files and directories, not just the number of gigabytes used. Millions of small cache files, old logs, backup archives, staging copies, and generated thumbnails can exhaust inodes while the disk-usage meter still appears acceptable.
Do these 3 things before closing this tab:
1Clear out junk files and repair common Windows errors2Scan for outdated or missing drivers - takes under a minute3Repair Windows errors before they cause bigger problemsRank #4

- RYZEN 7 H 255 CPU - The Ryzen 7 H 255 is a chip from the Hawk Point family and is an upgraded version of the older Ryzen 7 8745H and has 8 cores (16 threads thanks to SMT support) that run at up to 4.9 GHz, together with the powerful Radeon 780M iGPU. Unlike Zen 3, Zen 4 offers AVX512 support along with other improvements such as larger caches/registers/buffers across the board.
- GAMING PC - The Radeon 780M (12 CUs / 768 shaders, up to 2,600 MHz) can drive multiple displays simultaneously with a resolution of up to 8K. Hardware encoding and hardware decoding of the most common video codecs (AV1, AVC, HEVC) is also no problem; playing the latest games on FSR settings without issues.
- WHY CHOOSE DDR5 5600MHz DUAL CHANNEL (2×16GB): With a 5600MHz clock—a 17% frequency uplift over 4800MHz—this kit delivers massive bandwidth gains that elevate real-world performance. Gamers enjoy higher minimum FPS and less stutter in open-world and sim titles for a smoother competitive experience. Video editors and 3D creators benefit from faster 4K/8K timeline scrubbing, quicker renders in DaVinci Resolve and Premiere, and swifter asset loading. For AI/LLM workloads, the superior throughput reduces I/O bottlenecks, cuts token generation latency, and accelerates model fine-tuning by keeping processing cores fed with data—so you wait less and create more.
- 32GB DDR5 RAM + 512GB SSD - The K12 mini computer is equipped with Dual 16GB (Total 32GB) SO-DIMM DDR5 5600MHz memory sticks. 512GB PCIE 4.0 SSD Drive with 3x M.2 2280 Expansion slots. Each slot capable of reading up to 8TB. (24TB MAX)
- QUAD SCREEN 4K DISPLAY SUPPORT - K12 Mini PC support 4-screen 4K/8K output via HDMI 2.1 (8K@60Hz), DisplayPort 1.4 (4K@60Hz), and USB Type-C Transfer speed (supporting PD3.0/DP1.4/DATA). Ideal for gaming, video editing, and multitasking, it provides expansive and crisp multi-display support.
- Confirm that the inode or file-count graph, rather than CPU or entry processes, is faulting.
- Inventory the largest directories by file count.
- Remove obsolete backups, cache files, logs, staging copies, and old media only after confirming they are not needed for recovery or the live site.
- Configure retention limits so the same directories do not grow without bound.
- Ask the host whether the account’s inode quota or storage plan is appropriate if normal site operation repeatedly reaches it.
Do not delete unfamiliar directories simply because they contain many files. Confirm ownership and purpose first; removing active WordPress uploads, session data, or security logs can create a new outage.
How to investigate a plugin, theme, or scheduled task
The generic error does not identify a particular extension. You need a time correlation and a reproducible workload before blaming a plugin.
Use timing and logs, not guesswork
Compare the first fault with the installation, update, or configuration time of recent changes. Look for a single endpoint, cron event, import, or media operation that appears whenever the limit is reached. If the error occurs only during one administrative action, reproduce that action on a staging copy while monitoring the same resource category.
Test changes safely
- Take a verified backup before changing plugins, themes, or scheduled jobs.
- Test the suspected change on staging when possible.
- Change one variable at a time so the next resource graph has an interpretable result.
- After deployment, watch the account during the period when the fault previously occurred.
If disabling one extension appears to help, confirm the result across more than one normal workload. A coincidental traffic lull can look like a fix.
When a hosting upgrade or limit increase is appropriate
A higher-resource plan is reasonable when the logs show legitimate, recurring demand and optimization has removed avoidable work. Tell the host exactly which limit is faulting and provide timestamps and graphs. Do not choose more memory solely because the browser says “resource”; entry-process, CPU, I/O, process, and inode limits require different capacity.
| Evidence | First response | When additional capacity makes sense |
|---|---|---|
| Entry-process faults during ordinary page traffic | Full-page caching, bot controls, faster requests, and fewer simultaneous jobs | Traffic remains legitimate and recurring after those changes |
| CPU faults during expected application work | Optimize queries and plugins; reduce frequency or batch size | The workload cannot be reduced without removing required functionality |
| I/O faults during backups or media jobs | Stagger and resize jobs; reduce redundant reads and writes | Normal operations still exceed the account’s I/O allowance |
| Memory or process faults | Find leaking or worker-heavy tasks; reduce concurrency | The site’s normal worker requirement exceeds the assigned quota |
| Inode faults | Clean retained files and set retention rules | Normal file growth repeatedly reaches the inode allowance |
Ask prospective hosts how they expose per-account limits, fault history, and historical graphs. Transparent measurements make it possible to choose a targeted increase instead of paying for capacity that does not address the fault.
Best Value

- Boosts System Performance: 32GB DDR5 RAM laptop memory kit (2x16GB) that operates at 5600MHz, 5200MHz, or 4800MHz to improve multitasking and system responsiveness for smoother performance
- Accelerated gaming performance: Every millisecond gained in fast-paced gameplay counts—power through heavy workloads and benefit from versatile downclocking and higher frame rates
- Optimized DDR5 compatibility: Best for 12th Gen Intel Core and AMD Ryzen 7000 Series processors — Intel XMP 3.0 and AMD EXPO also supported on the same RAM module
- Trusted Micron Quality: Backed by 42 years of memory expertise, this DDR5 RAM is rigorously tested at both component and module levels, ensuring top performance and reliability
- ECC Type = Non-ECC, Form Factor = SODIMM, Pin Count = 262-Pin, PC Speed = PC5-44800, Voltage = 1.1V, Rank And Configuration = 1Rx8
Prevention checklist
- Keep full-page caching enabled and verify that logged-out pages are actually cacheable.
- Review Resource Usage after traffic campaigns, product launches, imports, migrations, and backups.
- Keep WordPress core, themes, plugins, and PHP maintained, and remove extensions that are no longer used.
- Inspect crawler and XML-RPC traffic when entry processes spike.
- Stagger
wp-cron, backup, image, and feed jobs so they do not overlap with predictable traffic peaks. - Set uptime and resource alerts that include a timestamp, affected URL, and status code.
- Keep tested backups, but enforce retention so backup and log directories do not consume all inodes or storage.
- Document the account’s normal CPU, memory, I/O, process, and entry-process levels so an abnormal graph is obvious.
Common symptoms and the right next move
The error appears only during a traffic spike
Check entry-process faults first, then confirm whether anonymous pages are bypassing the full-page cache. Review bot requests before purchasing a larger plan; abusive or repetitive traffic can create the spike without representing real visitors.
The error appears at the same time every night
Compare the timestamp with backups, feeds, image jobs, imports, exports, and scheduled WordPress tasks. A repeatable schedule points to a job-driven fault. Stagger or resize that job, then monitor the next scheduled run.
The site returns 500 or 503 instead of 508
Inspect memory and total-process faults as well as PHP error logs. A different status code does not rule out CloudLinux enforcement; it may indicate a different quota than concurrent entry processes.
Changing PHP memory_limit did nothing
That setting controls a script’s requested PHP memory ceiling. It does not increase the hosting account’s CloudLinux physical-memory, process, CPU, I/O, or entry-process allowance. Return to Resource Usage and identify the account-level fault.
The panel shows no current fault
Use the historical range that contains the incident and provide the timestamp to the host. A transient quota breach can disappear before you inspect the live graph.
A practical decision sequence
- Capture the error time, URL, action, and complete response.
- Check Resource Usage or the CloudLinux view for the matching historical fault.
- Classify the event as entry-process, CPU, I/O, memory, process, or inode pressure.
- Correlate the spike with visitors, crawlers, cron, backups, imports, exports, media work, and recent code changes.
- Apply the smallest evidence-based change: cache pages, control bots, optimize the slow workload, stagger jobs, reduce file retention, or reconfigure worker usage.
- Monitor the same workload during the next comparable period.
- Request an increase to the specific limit only when legitimate demand remains after optimization.
This sequence prevents the most expensive mistake: treating every 508 as a generic WordPress or memory problem. The message is a symptom of an account quota; the measured fault determines the repair.
What’s actually slowing this PC down?
Pick the symptom - the matching free tool is one click away.
Quick Recap
Product prices and availability are accurate as of the date/time indicated and are subject to change. Any price and availability information displayed on Amazon at the time of purchase will apply.




