The transparent way to estimate a data center’s electricity cost is to start with annual IT energy, convert it to whole-facility energy with power usage effectiveness (PUE), then apply the site’s electricity rate:
IT energy (kWh) = average IT load (kW) × operating hours
Facility energy (kWh) = IT energy (kWh) × PUE
Energy-only cost = facility energy (kWh) × applicable energy price ($/kWh)
As an Amazon Associate I earn from qualifying purchases.
Use metered annual kWh whenever possible. A complete utility bill may also include demand charges, taxes, riders, and contract-specific items, so the multiplication above is an energy-charge estimate rather than a universal billing formula.
PC Slower Than It Used to Be?
A free scan shows the junk files, broken settings and background clutter dragging Windows down - then fixes them in one click.Free scan · Windows 10 & 11Crashes, No Sound, or Screen Glitches?
Random freezes, missing sound and display glitches usually trace back to one bad driver. Find and replace yours safely.Free scan · under a minute1. Define exactly what you are estimating
Before entering numbers in a spreadsheet, define the facility boundary, period, and energy types. Otherwise, two calculations can both be mathematically correct while describing different loads.
#1 Best Overall

- SMART - Wi-Fi connection provides remote monitoring and control of your Leviton Load Center, OTA firmware updates, and more
- INTUITIVE - Monitor whole-home energy consumption and production in real-time and view what power source(s) are powering your home
- CONTROL - Remotely control (OFF/ON) Leviton 2nd Gen Smart Circuit Breakers. Program custom schedules for 2nd Gen Smart Circuit Breaker activity to conserve energy and avoid running circuits when electricity is its most expensive
- FLEXIBLE - When integrated with an Automatic Transfer Switch and compatible backup power system, the LWHEM-2R automatically sheds nonessential 2nd Gen Smart Circuit Breakers when backup power is active, preserving power for essential circuits
- WHOLE HOME - The My Leviton app delivers a streamlined Smart Home and Energy Management experience by unifying control, scheduling, and personalization of Leviton Smart Circuit Breakers, Decora Smart Wi-Fi Lighting, and Evr-Green Electric Vehicle Chargers in a single interface
Choose the facility boundary
For a dedicated data-center building, the boundary normally includes energy used within that building. In a mixed-use building, exclude unrelated shared services unless they support the data center. Include ancillary systems dedicated to data-center operations, such as dedicated cooling, power conditioning, pumps, controls, and lighting. The U.S. Department of Energy (DOE) measurement guidance recommends that the facility-energy numerator and IT-energy denominator use the same boundary.
Choose the measurement period
Use a full 12-month period when you can. Cooling loads, weather, maintenance, occupancy, and IT demand change through the year, so a monthly or annual total is more representative than one afternoon reading. For a non-leap year running continuously, the arithmetic conversion is 8,760 hours. A leap year has 8,784 hours.
Decide which energy types belong in the estimate
An all-electric site can be estimated from electricity meters alone. If the site uses natural gas, district heating, chilled water, or another non-electric energy source, follow a measurement method that accounts for those sources instead of silently treating the facility as all-electric. State whether the result is electricity-only or a broader site-energy result.
Free tools Windows power users keep installed
One-click scans. No signup required.
2. Measure or estimate IT energy
Best option: annual metered IT kWh
The strongest starting point is the annual kWh measured at the IT boundary—typically the output of UPS systems or another meter that captures servers, storage, and networking equipment while excluding supporting infrastructure. Confirm what the meter includes, its accuracy, and whether its interval data cover the same dates as the facility meter.
When only average IT power is available
Multiply the average IT load by the operating hours:
IT kWh = average IT kW × hours in the period
An average of 500 kW over 8,760 hours produces 4,380,000 kWh, or 4.38 GWh. Do not substitute the peak demand reading for average load unless you intentionally want a conservative upper-bound scenario; doing so can substantially overstate annual consumption.
Build a component estimate when there is no IT meter
Add estimated consumption for servers, storage, and networking:
Rank #2

- ⚡ EASY INSTALLATION: Installs in circuit panel of most homes with clamp-on sensors. Supports single-phase up to 240VAC line-neutral; single, split-phase 120/240VAC; and three-phase up to 415Y/240VAC (no Delta). The branch lines can automatically match different phases and have no restrictions in terms of quantity and voltage.Panels with access only to busbars will need flexible sensors available from SEM-Meter.
- ⚡ ENERGY MONITORING ANYTIME, ANYWHERE: Monitor your home's real power anywhere, anytime to prevent costly repairs, conserve energy, and save costs. Monitor solar / net metering. Light commercial 3 phase option available as a separate bundle. Protected by a 1-year warranty.
- ⚡ VARIOUS ELECTRICAL APPLIANCE MONITORING: Comes with 16 50A sensors to accurately monitor your air conditioner, furnace, water heater, washer, dryer, range, etc.
- ⚡ LOWER YOUR ELECTRIC BILL: SEM-Meter measures real-time spending and gets actionable notifications to understand where savings can be made, both to lower your electric bill and to conserve energy and protect the planet’s resources. Be an environmentalist.
- ⚡ REAL-TIME ENERGY DATA: Connect SEM-Meter device via 2.4GHz WiFi to monitor energy usage, with an accuracy range of 1%. View usage in real time through Android/Apple software. Statistics of power usage in now/day/week/month/year format: the validity period of hourly exported data is 90 days, and the exported data of day/month/year data is permanent, available at any time Export from application.
Annual device kWh = device count × average device kW × operating hours
Use measured draw or vendor operating-range data instead of nameplate maximums where possible. A server’s annual average depends on utilization, idle draw, workload mix, power-management settings, and the fraction of equipment actually powered on. DOE and Lawrence Berkeley National Laboratory’s national model includes equipment shipments, unit power, utilization, idle power, location, cooling, and modeled PUE for this reason. Nameplate ratings are useful for electrical design and capacity planning, but they are not a reliable annual-energy measurement by themselves.
3. Apply PUE to account for infrastructure
Power usage effectiveness is defined as:
PUE = total annual facility energy ÷ annual IT equipment energy
Rearrange it for an estimate:
Facility kWh = IT kWh × PUE
A measured PUE should cover the same boundary and period as the IT kWh. If you use a planning value, label it as an assumption rather than presenting it as a measured property of the facility.
Illustrative PUE values
DOE’s 2024 Best Practices Guide for Energy-Efficient Data Center Design presents 1.6 as “standard,” 1.4 as “good,” and 1.1 as “better” in one comparison table, and discusses an average PUE of 1.6. The guide also cites Uptime Institute’s 2022 annual average of 1.55 for large data centers. These are guide-specific reference points, not universal targets or defaults for every building. A site’s climate, redundancy, cooling design, utilization, and measurement boundary can produce a different result.
What PUE does—and does not—tell you
A PUE of 1.5 means the facility uses 1.5 kWh for every 1 kWh delivered to IT equipment; the additional 0.5 kWh represents infrastructure overhead under that measurement. PUE does not measure how efficiently a workload is performed, how much useful computation is delivered, or whether water and carbon impacts are acceptable. For those questions, DOE recommends considering measures such as energy reuse effectiveness (ERE), water use effectiveness (WUE), carbon use effectiveness (CUE), and workload-oriented utilization metrics.
As DOE states in its 2024 guide: “It is important to note that PUE does not define the overall efficiency of an entire data center, but only the efficiency of the supporting equipment (the infrastructure) within a data center.”
Rank #3

- Real-time power monitoring -Track your home's overall energy usage with instant data and insights to help you manage electricity consumption efficiently.
- Comes with 16 50A sensors, enabling you to individually monitor air conditioners, lights, washing machines, etc., helping users optimize electricity usage and effectively improve energy efficiency.
- Set up instant alerts for anomalies-receive immediate notifications when abnormal power usage occurs, such as sudden voltage spikes, helping prevent energy waste and ensuring electrical safety.
- Stable and reliable-supports dual-band 2.4G/5G Wi-Fi and RJ45 wired connection, with convenient and intuitive web-based setup. The newly designed current transformer port offers improved stability and resolves the issue of inaccurate antenna-to-ground voltage, ensuring precise data measurement.
- Easy installation -Installs in circuit panel of most homes with clamp-on sensors. Supports single-phase up to 240VAC line-neutral; single, split-phase 120/240VAC and three-phase up to 415Y/240VAC (no Delta).
4. Convert facility energy to an energy-only cost
Once facility kWh is established, multiply it by the applicable energy price:
Energy-only cost = facility kWh × $/kWh
Use the rate that actually applies to the site, including the relevant tariff period or contract. A cents-per-kWh figure from another building, state, or year is not a valid substitute for the site’s rate.
Worked example
Assume the following purely illustrative inputs:
- Average IT load: 500 kW
- Operating time: 8,760 hours
- Assumed PUE: 1.5
- Illustrative energy price: $0.12/kWh
- IT energy: 500 kW × 8,760 h = 4,380,000 kWh/year (4.38 GWh).
- Facility energy: 4,380,000 kWh × 1.5 = 6,570,000 kWh/year (6.57 GWh).
- Energy-only cost: 6,570,000 kWh × $0.12/kWh = $788,400/year.
These outputs follow only from the stated assumptions. Replace the assumed load, PUE, hours, and price with metered values and the site’s tariff before using the result for budgeting.
5. Account for the utility tariff before calling it a bill estimate
The simple multiplication estimates the energy component. A commercial data-center bill can also include:
- Demand charges based on the highest average kW during specified intervals.
- Time-of-use, seasonal, or coincident-peak prices.
- Capacity, transmission, distribution, or riders.
- Taxes, regulatory fees, and other contract items.
- Renewable-energy or power-purchase-contract adjustments.
DOE’s 2025 brief on electricity rate designs for large loads discusses how utilities allocate system costs and manage the financial risks of serving very large customers. For a bill forecast, obtain the current tariff or contract, interval demand data, billing determinants, and any negotiated terms. Keep the energy-only result separate from those additional charges so readers can see which assumptions drive each number.
What’s actually slowing this PC down?
Pick the symptom - the matching free tool is one click away.
6. Make uncertainty visible with scenarios
A single-point answer can imply more precision than the data support. Use low, central, and high cases only when each case has explicit assumptions. For example, vary average IT load, PUE, and the energy rate independently rather than multiplying a peak load by a favorable rate and calling the result “typical.”
| Case | Average IT load | PUE | Energy price | Annual facility energy | Energy-only cost |
|---|---|---|---|---|---|
| Low | 400 kW | 1.4 | $0.10/kWh | 4,905,600 kWh | $490,560 |
| Central | 500 kW | 1.5 | $0.12/kWh | 6,570,000 kWh | $788,400 |
| High | 600 kW | 1.7 | $0.16/kWh | 8,935,200 kWh | $1,429,632 |
Each row assumes 8,760 operating hours. The figures are arithmetic examples, not benchmarks or forecasts. If a scenario uses a measured value, identify the meter and period; if it uses a planning assumption, label it accordingly.
Rank #4
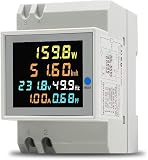
- 6 in 1 Electricity Usage Monitor Din Rail This single phase energy meter can measure AC voltage, AC current, active power, power factor, frequence and electric energy at the same time. The power meter have a colorful, full-view, highdefinition LCD to display the measure parameters.
- Electrical parameter measurement function (voltage, current, active power, electric energy, frequency, power factor) Data reset Store data when power off Colorful, full-view, high definition LCD screen Backlight function
- Active Power: 0.0~30000W Electric Energy: 0.00~99999Kwh Voltage: AC 40.0~300.0V Current: AC 0.00~100.0A Frequency: 45.0~65.0Hz Power factor: 1.00~0.00PF Accuracy: 1%±2 words Current Resolution: 0.01A Protruding Part Size: 54mmx45mmx16mm Installation Width=3P (DZ47/C45 air switch position)
7. Get PUE measurements that are fit for purpose
DOE recommends annual energy consumption in kWh for PUE calculations because it captures seasonal mechanical loads and changing IT demand. Its measurement guidance describes four PUE measurement categories. The entry-level category uses peak-demand readings over a 12-month period and is restricted to all-electric data centers; a snapshot can miss variation in both IT and mechanical loads.
Measurement checklist
- Record the start and end dates for every meter series.
- Confirm that facility and IT meters use the same time zone, interval, and boundary.
- Document whether UPS losses, battery charging, lighting, security, offices, and shared plant are included.
- Check meter multipliers, missing intervals, resets, and estimated utility reads.
- Separate maintenance outages or temporary generators from normal operating data.
- For mixed-use buildings, allocate shared systems with a documented method rather than assigning all building energy to the data center.
8. Compare two estimates without being misled
When two consultants, budgets, or facilities report different annual costs, compare the inputs before comparing the totals.
Do these 3 things before closing this tab:
1Repair Windows errors before they cause bigger problems2Scan for outdated or missing drivers - takes under a minute3Clear out junk files and repair common Windows errors| Comparison item | Question to ask |
|---|---|
| Period | Do both figures cover the same 12 months, weather, and operating conditions? |
| Boundary | Do both include the same building areas, ancillary systems, and non-electric energy? |
| IT load | Is it metered annual kWh, an average kW estimate, or a peak/nameplate assumption? |
| PUE | Is it measured for that period and boundary, or merely a planning assumption? |
| Rate | Is the figure an energy-only price, a tariff-based bill, or a blended contract rate? |
| Purpose | Are you comparing cost, infrastructure overhead, workload delivered, or environmental impact? |
For operational-efficiency comparisons, add workload served and relevant water, carbon, or energy-reuse metrics. A lower PUE does not automatically mean more useful work per kWh if the workloads differ.
Independent reader supportYour contribution helps us test, update, and keep practical guides available for everyone.9. Put national electricity forecasts in the right context
DOE and Lawrence Berkeley National Laboratory’s United States Data Center Energy Usage Report: 2025 Update models U.S. data-center electricity use at 649 TWh in its 2030 Reference Case. Its modeled sensitivity range is 9.5% to 15.3% of total U.S. electricity use in 2030. Those figures are national scenarios, not facility defaults.
The bottom-up model varies equipment shipments, unit power, utilization, location, cooling-system information, and PUE. A national projection cannot be converted into a particular building’s annual kWh without site-specific load, boundary, and operating data. Use it to understand scale and uncertainty, not to replace meters.
10. Practical tools and data sources
DOE’s Federal Energy Management Program (FEMP) data-center efficiency resources list the Data Center Profiler, Data Center Air Management Estimator, Data Center Metering and Resource Guide, and best-practices guidance. These resources can help with measurement planning and efficiency investigations; verify that a tool’s current version and assumptions fit the site before relying on an output.
FEMP’s storage procurement example uses 11¢/kWh, identified as the average electricity price at federal facilities in July 2024. That number is context for a federal procurement example, not a universal commercial data-center rate. The same page notes that storage products in ENERGY STAR Online 3 and 4 categories report input power across their operating range, which can be useful when building equipment-level estimates.
Best Value

- Managed DC PDU: Input Voltage of 10 - 60 VDC; Total Capacity of 80 A divided into 8 outputs of 10 A each; Includes individual fuses for protection on each output. Applications CriticalPower Loads; TelecommunicationNetworks; DataCenters; RenewableEnergy Systems; Alarm Systems. Remote management and monitoring play a crucial role in these products. The models include a secure and user-friendly interface through a web browser, providing remote power monitoring, displaying information on voltage, current, and power for each output, alarms, and control of operations through an Ethernet connection, along with SNMP support for integration into your network management system.
11. Common mistakes and how to correct them
Using peak kW for every hour
Problem: Peak demand is multiplied by 8,760 hours.
Correction: Use annual metered kWh or an interval-derived average. If peak is the only available value, show it as an explicit upper-bound scenario.
Applying PUE to the wrong boundary
Problem: A PUE measured for one hall or season is applied to a whole mixed-use campus.
Correction: Match the PUE period and boundary to the IT-energy estimate, or disclose the mismatch and its likely effect.
Treating nameplate power as consumption
Problem: Server or storage ratings are summed as if equipment runs at its maximum continuously.
Correction: Model utilization, idle draw, power-management behavior, and actual powered-on inventory.
Recommended Free Tools
Calling an illustrative rate “the data-center rate”
Problem: A rounded cents-per-kWh assumption is presented as a current market price.
Correction: Identify the tariff, contract, location, effective dates, and whether demand charges are included.
Using a consumer plug-in watt meter for a facility total
Problem: A small-device reading is extrapolated to the entire building.
Correction: Use revenue-grade or appropriately rated facility and rack metering, with qualified personnel where electrical work is required.
12. A repeatable worksheet
- Write the facility name, geographic location, boundary, and measurement dates.
- List every included energy source and meter, including units and interval length.
- Enter annual IT kWh, or calculate it from average IT kW and documented operating hours.
- Enter measured PUE for the same period, or mark the value as an assumption.
- Calculate facility kWh as IT kWh multiplied by PUE.
- Enter the applicable energy rate and calculate the energy-only cost.
- Add tariff-based demand and other charges in separate lines rather than hiding them in a blended rate.
- Run clearly labeled low, central, and high cases.
- Record data-quality issues, missing intervals, allocation methods, and meter uncertainty.
- Reconcile the result to utility bills and investigate material differences before using it for capital or operating decisions.
13. What a defensible result should report
A reader or decision-maker should be able to reproduce the estimate from the published assumptions. Include:
- Annual period and whether the year is leap or non-leap.
- Facility and IT measurement boundaries.
- Measured or estimated IT load, with the meter or modeling method.
- PUE value, source, and whether it is measured or assumed.
- Included and excluded energy sources.
- Energy rate, tariff, contract date, and treatment of demand charges.
- Calculated IT kWh, facility kWh, and energy-only cost.
- Scenario ranges and the assumptions that create them.
This level of disclosure prevents a precise-looking number from being mistaken for a universal data-center cost.
Quick wins for a faster PC:
Repair Windows errors before they cause bigger problemsFix Now →Scan for outdated or missing drivers - takes under a minuteDriver Scan →Quick Recap
Product prices and availability are accurate as of the date/time indicated and are subject to change. Any price and availability information displayed on Amazon at the time of purchase will apply.




