Do these 3 things before closing this tab:
1Repair Windows errors before they cause bigger problems2Scan for outdated or missing drivers - takes under a minute3Clear out junk files and repair common Windows errorsCompare data center energy estimates only after matching their geography, year, metric, system boundary, method and uncertainty. The latest U.S. estimate located here puts data center electricity use at 192 TWh in 2024; a separate global estimate is about 415 TWh for the same year. Those are not competing answers: they cover different geographies and should be labeled accordingly.
What do the latest estimates say?
Lawrence Berkeley National Laboratory (LBNL) estimates that U.S. data centers used 192 terawatt-hours (TWh) of electricity in 2024, equal to 4.7% of total U.S. electricity consumption. Its 2025 update, published in 2026, covers servers, storage, network equipment and supporting infrastructure, and excludes cryptocurrency mining. The report treats 2024 as its last historical year because its main IT shipment data extend only through the first three quarters of 2025. Read the LBNL report.
As an Amazon Associate I earn from qualifying purchases.
For the world, the International Energy Agency (IEA) estimates data centers used about 415 TWh in 2024, or 1.5% of global electricity consumption. The IEA’s 2025 base case projects about 945 TWh in 2030. This is a global estimate, not a U.S. figure or an alternative measurement of the LBNL total. Read the IEA analysis.
How should you compare two estimates?
Before comparing numbers, write down what each one measures. A useful comparison keeps the following dimensions visible:
#1 Best Overall

- SMART - Wi-Fi connection provides remote monitoring and control of your Leviton Load Center, OTA firmware updates, and more
- INTUITIVE - Monitor whole-home energy consumption and production in real-time and view what power source(s) are powering your home
- CONTROL - Remotely control (OFF/ON) Leviton 2nd Gen Smart Circuit Breakers. Program custom schedules for 2nd Gen Smart Circuit Breaker activity to conserve energy and avoid running circuits when electricity is its most expensive
- FLEXIBLE - When integrated with an Automatic Transfer Switch and compatible backup power system, the LWHEM-2R automatically sheds nonessential 2nd Gen Smart Circuit Breakers when backup power is active, preserving power for essential circuits
- WHOLE HOME - The My Leviton app delivers a streamlined Smart Home and Energy Management experience by unifying control, scheduling, and personalization of Leviton Smart Circuit Breakers, Decora Smart Wi-Fi Lighting, and Evr-Green Electric Vehicle Chargers in a single interface
- Geography: Is the estimate for the United States, the world, a region or one facility?
- Year and status: Is the figure a historical estimate, a current-year estimate, a forecast or a scenario? A forecast year is not a measurement of current consumption.
- Metric: Does it report electricity consumption in TWh, power capacity in gigawatts (GW), or total primary energy? These are different quantities and cannot be substituted for one another.
- System boundary: Does the total include only IT equipment, or also cooling and other facility infrastructure? Are cryptocurrency-mining operations included?
- Method: Is the number metered, modeled from equipment and operating assumptions, or assembled another way?
- Scenario and uncertainty: Is the number a reference or base case, a sensitivity result, or a high/low uncertainty bound?
- Publication vintage: When were the underlying data and assumptions collected, and has a later edition revised earlier years?
If any of these differ, the figures may answer different questions. Do not rank them as though one must be wrong simply because the totals diverge.
What do the U.S. and global forecasts mean?
LBNL’s U.S. 2030 reference case is 649 TWh. Its compounded uncertainty bounds are 521–843 TWh. Those bounds express the breadth of modeled uncertainty; the reference case is not a guaranteed outcome, and the midpoint of the bounds is not a prediction that consumption will reach. The estimate belongs to LBNL’s U.S. scope and model. LBNL’s 2025 update describes the forecast and its sensitivity cases.
Rank #2

- ⚡ EASY INSTALLATION: Installs in circuit panel of most homes with clamp-on sensors. Supports single-phase up to 240VAC line-neutral; single, split-phase 120/240VAC; and three-phase up to 415Y/240VAC (no Delta). The branch lines can automatically match different phases and have no restrictions in terms of quantity and voltage.Panels with access only to busbars will need flexible sensors available from SEM-Meter.
- ⚡ ENERGY MONITORING ANYTIME, ANYWHERE: Monitor your home's real power anywhere, anytime to prevent costly repairs, conserve energy, and save costs. Monitor solar / net metering. Light commercial 3 phase option available as a separate bundle. Protected by a 1-year warranty.
- ⚡ VARIOUS ELECTRICAL APPLIANCE MONITORING: Comes with 16 50A sensors to accurately monitor your air conditioner, furnace, water heater, washer, dryer, range, etc.
- ⚡ LOWER YOUR ELECTRIC BILL: SEM-Meter measures real-time spending and gets actionable notifications to understand where savings can be made, both to lower your electric bill and to conserve energy and protect the planet’s resources. Be an environmentalist.
- ⚡ REAL-TIME ENERGY DATA: Connect SEM-Meter device via 2.4GHz WiFi to monitor energy usage, with an accuracy range of 1%. View usage in real time through Android/Apple software. Statistics of power usage in now/day/week/month/year format: the validity period of hourly exported data is 90 days, and the exported data of day/month/year data is permanent, available at any time Export from application.
The IEA’s global 2030 base case is about 945 TWh. It is useful alongside LBNL’s forecast only when the geography and scenario labels remain attached. The IEA notes, “There is substantial uncertainty both about data centre consumption today and in the future.” Its scenario framing identifies efficiency, AI uptake and bottlenecks among the factors that shape demand. IEA, Energy and AI.
How are national estimates built?
LBNL uses a bottom-up model rather than a single meter reading of every data center. It combines equipment shipments and installed stock with assumptions about equipment power and operation, estimates IT electricity use, then applies a modeled power usage effectiveness (PUE) to account for facility electricity beyond IT equipment. LBNL describes the approach as a “bottom-up” energy-use model. The report explains its modeling approach.
Rank #3

- Real-time power monitoring -Track your home's overall energy usage with instant data and insights to help you manage electricity consumption efficiently.
- Comes with 16 50A sensors, enabling you to individually monitor air conditioners, lights, washing machines, etc., helping users optimize electricity usage and effectively improve energy efficiency.
- Set up instant alerts for anomalies-receive immediate notifications when abnormal power usage occurs, such as sudden voltage spikes, helping prevent energy waste and ensuring electrical safety.
- Stable and reliable-supports dual-band 2.4G/5G Wi-Fi and RJ45 wired connection, with convenient and intuitive web-based setup. The newly designed current transformer port offers improved stability and resolves the issue of inaccurate antenna-to-ground voltage, ensuring precise data measurement.
- Easy installation -Installs in circuit panel of most homes with clamp-on sensors. Supports single-phase up to 240VAC line-neutral; single, split-phase 120/240VAC and three-phase up to 415Y/240VAC (no Delta).
This approach can estimate a national total where comprehensive facility-level metering is not the method being reported, but the output depends on the inputs. A model-based national estimate is not the same thing as a directly metered national total. A facility operator measuring one site, meanwhile, is answering a narrower question than a national model.
Which assumptions can change the answer?
Equipment shipments and installed stock
A bottom-up forecast depends on how many servers and accelerators are installed, and how quickly new equipment enters service. LBNL tests lower equipment installations and greater use of specialized graphics chips in separate sensitivity cases. Different shipment data or deployment assumptions can therefore change the projected total. See LBNL’s sensitivity analysis.
Rank #4
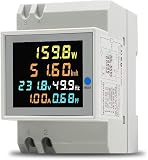
- 6 in 1 Electricity Usage Monitor Din Rail This single phase energy meter can measure AC voltage, AC current, active power, power factor, frequence and electric energy at the same time. The power meter have a colorful, full-view, highdefinition LCD to display the measure parameters.
- Electrical parameter measurement function (voltage, current, active power, electric energy, frequency, power factor) Data reset Store data when power off Colorful, full-view, high definition LCD screen Backlight function
- Active Power: 0.0~30000W Electric Energy: 0.00~99999Kwh Voltage: AC 40.0~300.0V Current: AC 0.00~100.0A Frequency: 45.0~65.0Hz Power factor: 1.00~0.00PF Accuracy: 1%±2 words Current Resolution: 0.01A Protruding Part Size: 54mmx45mmx16mm Installation Width=3P (DZ47/C45 air switch position)
Power draw, utilization and idle operation
A server’s rated wattage is not its annual energy use. The LBNL model considers rated and maximum power, utilization and idle power to estimate average server wattage over time. How heavily equipment runs—and how much electricity it draws when less busy—can shift an estimate, especially for AI servers. Treating a nameplate rating as if it were continuous measured consumption skips those operating assumptions.
Outdated Drivers Are Slowing You Down
One free scan finds every outdated or missing driver and matches the right update for your exact hardware.Free scan · exact hardware matchWindows Errors? Fix Them Before They Spread
Repair common Windows errors and clear accumulated junk for a smoother, more stable PC - no reinstall needed.Free scan · no reinstallHardware lifetime and efficiency
Forecasts also depend on how long accelerators stay in service and how much hardware or software improvements reduce energy per task. LBNL tests a shorter assumed AI-chip lifetime as a sensitivity. The IEA identifies efficiency and AI adoption among its uncertain demand drivers. A forecast that assumes rapid efficiency gains may differ substantially from one assuming deployments grow faster than efficiency improves.
Best Value

- Managed DC PDU: Input Voltage of 10 - 60 VDC; Total Capacity of 80 A divided into 8 outputs of 10 A each; Includes individual fuses for protection on each output. Applications CriticalPower Loads; TelecommunicationNetworks; DataCenters; RenewableEnergy Systems; Alarm Systems. Remote management and monitoring play a crucial role in these products. The models include a secure and user-friendly interface through a web browser, providing remote power monitoring, displaying information on voltage, current, and power for each output, alarms, and control of operations through an Ethernet connection, along with SNMP support for integration into your network management system.
Facility overhead and PUE
IT equipment is only part of a data center’s electricity use. Cooling and other infrastructure add facility overhead, which LBNL models with PUE. Comparing a total that includes these systems with an estimate that counts IT equipment alone produces an apples-to-oranges comparison. Check whether the value is IT-only or whole-facility electricity before interpreting a difference.
Independent reader supportYour contribution helps us test, update, and keep practical guides available for everyone.Why can an older estimate disagree with a newer one?
A revised historical figure does not automatically mean data centers used more or less electricity in the past. In its 2025 update, LBNL revised past estimates in part because reported GPU shipments and assumptions about AI inference-server power changed. That is a change in the estimate’s data or method; it should not be confused with a newly observed change in consumption. When quoting a number, include the report year or edition as well as the consumption year. LBNL’s update documents the revised estimates.
A quick test for a potentially misleading claim
- Find the original source. Check whether the number is attributed to LBNL, the IEA or another source, rather than repeated without context.
- Attach the geography and year. For example, “U.S., 2024 estimate” is materially clearer than “data centers use 192 TWh.”
- Check the unit and boundary. Confirm that the claim means electricity consumption, and whether it includes facility infrastructure or excludes crypto mining.
- Identify the method and scenario. Separate a modeled estimate or forecast from metered consumption; distinguish a reference case from an uncertainty range.
- Keep the report vintage visible. A newer edition may have revised past estimates because its data or assumptions changed.
- Retain the uncertainty range when provided. Quoting only a reference case can hide how much outcomes vary across modeled assumptions.
A number that omits these labels may still be useful as a rough pointer, but it is not enough to establish a like-for-like comparison.
Quick Recap
Product prices and availability are accurate as of the date/time indicated and are subject to change. Any price and availability information displayed on Amazon at the time of purchase will apply.




