Free tools Windows power users keep installed
One-click scans. No signup required.
To benchmark a local LLM meaningfully, measure prompt processing and output generation separately, record the exact model, runtime, hardware and workload, then repeat the run and report variability. “Tokens per second” is not one universal speed: it may describe input processing, generated output or the combined work of a serving system. Pair throughput with latency when you care about how a chat feels.
What tokens per second should you measure?
Choose the metric that answers your question before running a test. Local inference has distinct phases, and a fast result in one phase does not establish speed in another.


As an Amazon Associate I earn from qualifying purchases.
- Prompt processing (prefill) tokens/s: input tokens processed during the prompt-processing interval. Use this for questions about long prompts or context ingestion.
- Output generation (decode) tokens/s: generated tokens per unit of generation time. This is the most relevant throughput measure for the pace of a single response.
- Total token throughput: prompt and generated tokens processed per unit time. This is useful for aggregate serving capacity, but it is not the same as output generation speed.
- Requests/s: completed requests per second for a defined mix of prompt and output lengths.
For a single-user chat experience, look at output generation speed and latency. For a server, report output-token throughput and total-token throughput as separately labelled figures, along with the request workload.
Record the setup and workload
A speed result is useful only alongside the conditions that produced it. Capture enough detail that you—or someone else—can rerun the same workload.
- Model: exact model and quantization.
- Runtime: inference engine and version, plus relevant launch options.
- Hardware and execution mode: CPU, GPU and memory configuration, and whether any layers or work are offloaded.
- Context and request sizes: context length, prompt-token length and requested output-token length.
- Generation settings: sampling settings and any relevant stop or EOS behavior.
- Server load: request count, request rate and concurrency. State whether the server is warmed up or freshly started, and describe cache conditions.
- Measurement boundary: say whether timing includes tokenization, sampling, queueing, client work and network transport.
These details determine what a number means. If you change model, quantization, context depth, cache behavior or request mix, you are measuring a different workload—not necessarily making an apples-to-apples comparison.
Choose a benchmark method that matches the question
Use llama-bench for engine-level phase measurements
The llama.cpp llama-bench documentation labels its test phases pp for prompt processing, tg for text generation and pg for combined prompt-plus-generation. Select the phase that represents your use case; a pp result is not generation speed. The documentation says the tool repeats tests and reports average tokens per second with standard deviation. It also states that its measurements exclude tokenization and sampling time, so treat them as engine measurements rather than full application response times.
Rank #2

- Unlock next-generation AI computing with AMD Ryzen AI Max+ 395 processor featuring 16 cores, 32 threads, up to 5.1GHz boost clock, and integrated Ryzen AI engine delivering up to 126 TOPS AI performance. EVO-X3 is designed for local AI models, content creation, development, and professional workloads.
- OCuLink External GPU Expansion – Upgrade Beyond a Mini PC: Take your graphics performance further with a dedicated OCuLink (PCIe 4.0 x4) interface. Connect an external GPU dock to add desktop-class graphics power for AAA gaming, AI acceleration, 3D rendering, video production, and advanced creative applications. EVO-X3 gives you the flexibility of a compact PC with workstation-level expansion capability.
- AI NPU with XDNA 2 ARCHITECTURE - Powered by 16 “Zen 5” CPU cores, 50+ peak AI TOPS XDNA 2 NPU and a truly massive integrated GPU driven by 40 AMD RDNA 3.5 CUs, the Ryzen AI MAX+ 395 is a transformative upgrade and delivers a significant performance boost over the competition. The Ryzen AI Max+ 395 excels in consumer AI workloads like the llama.cpp-powered application: LM Studio. Shaping up to be the must-have app for client LLM workloads, LM Studio allows users to locally run the latest language model without any technical knowledge required and unleash their creativity and productivity.
- AMD RADEON 8090S iGPU GAMING PC - The AMD Radeon RX 8060S offers all 40 CUs with up to 2.9 GHz graphics clock and uses the new RDNA 3.5 architecture. The powerful iGPU is positioned between an RTX 4060 and 4070 laptop GPU and therefore enables gaming in FHD at maximum details in most demanding games. The 8060S can also utilize the full 128GB pool, which is perfect for running LLMs such as Deepseek 70B Q8, which runs comfortably on this machine.
- EIGHT CHANNEL LPDDR5X - LPDDR5X is a new ground breaking memory small form factor installed on-board. With blazing speeds up to to 8000MT/s, it runs 1.5x faster than the DDR5 SODIMMs; 90% better performance over DDR5 SODIMMs in video conferencing and photo editing; 30% better performance in productivity apps; 12% better performance in digital content workloads.
Use a serving benchmark for server capacity
A server benchmark exercises a broader request path and lets you specify workload characteristics such as request rate, burstiness and maximum concurrency. The vLLM benchmarking CLI documentation describes these controls. Record them alongside prompt and output lengths: throughput under steady, low load is not interchangeable with maximum throughput under heavy concurrency.
Quick wins for a faster PC:
Fix the driver behind crashes, sound loss and screen glitchesFind Drivers →Repair Windows errors before they cause bigger problemsFix Now →Scan for outdated or missing drivers - takes under a minuteDriver Scan →The vLLM Llama 3.3 70B recipe provides a sample serving benchmark command and recommends using at least five times as many prompts as the maximum concurrency for steady-state measurement. That is guidance for the recipe’s procedure, not a universal rule for every benchmark. Use the current command options supported by your installed version.
Run and report a repeatable test
- Define the target. Decide whether you need prompt-processing speed, single-stream generation pace, combined processing, or serving capacity.
- Fix the workload. Set prompt and output lengths, request rate and concurrency as appropriate. For serving, use a dataset or explicitly specified fixed or randomized lengths, and document how requests terminate.
- Set the measurement boundary. Note what the benchmark includes. For example, llama-bench excludes tokenization and sampling; a client/server measurement may include queueing or transport depending on the tool.
- Warm up or deliberately measure cold start. State which condition you chose and keep it consistent across runs. Do not compare a warmed-up result with a freshly started one without identifying the difference.
- Repeat the run and retain raw output. Report the number of repetitions and the average and standard deviation for repeated engine tests. For request-serving measurements, report an appropriate distribution such as median and percentiles as well as the measurement period; do not select only the fastest run.
- Save the exact invocation and configuration. Include the command or benchmark settings, tool version, model details and workload values so the test can be reproduced. Check the installed tool’s help because project documentation and command options can change.
Add latency measures for interactive use
Throughput alone does not tell you how long a person waits. For interactive workloads, report latency alongside tokens per second:
- TTFT (time to first token): time from request submission until the first output token. It captures initial responsiveness.
- TPOT (time per output token): the per-request time per generated token after the first, describing generation pace.
- ITL (inter-token latency): time between streamed output events. It can differ from TPOT if an event contains multiple tokens.
- End-to-end latency: time from submitting a request until its final output.
The vLLM metrics documentation defines these measures and explains the distinction between TPOT and ITL. A server can increase total throughput by batching work across concurrent requests, while individual requests experience greater latency; the vLLM recipe explicitly notes this throughput–latency trade-off. Report the load at which each latency figure was measured.
Rank #4
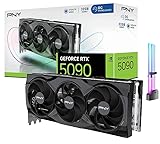
- [3352 AI TOPS, 5th Gen Tensor Cores, AI Content Creation] Accelerate AI-powered photo and video workflows like upscaling, denoise, background removal, masking, and generative AI creation for faster creator productivity.
- [32GB GDDR7 VRAM, Local LLM Inference, ML Workflows] Run local LLM inference and on-device AI tools with more VRAM headroom for larger models, longer context, and heavier multitasking across AI and creator apps.
- [DLSS 4, Reflex 2, 4th Gen Ray Tracing Cores] Smooth modern gaming with AI-enhanced performance and responsiveness in supported titles, plus advanced ray-traced visuals for immersive experiences.
- [28 Gbps, 512-bit, 1792 GB/s Bandwidth] High-throughput next-gen memory for demanding creator projects, 8K assets, complex timelines, and GPU-accelerated workloads that benefit from massive bandwidth.
- [DP 2.1b UHBR20 x3, HDMI 2.1b, Bundle GPU Holder] Multi-display ready with up to 4 displays, supports up to 4K 480Hz or 8K 120Hz with DSC (display and cable dependent), plus an included GPU Holder to help reduce GPU sag and improve build stability.
Compare results without overstating them
There is no universal “good” local tokens-per-second target established by the cited tool guidance. A result is comparable only when the important conditions align. For two setups, match or clearly disclose:
What’s actually slowing this PC down?
Pick the symptom - the matching free tool is one click away.
- model and quantization;
- runtime, version and measurement boundary;
- prompt length, output length and context depth;
- cache and warm-up conditions;
- request rate, concurrency and request mix; and
- tokenization and generation settings.
When a comparison changes model or quantization, include quality and output behavior if they matter to the decision; a faster configuration is not automatically equivalent. Memory use and stability are also useful comparison axes. Measure energy use or noise only with appropriate instrumentation rather than inferring either from throughput.
Project documentation evolves. The llama-bench reference linked here is a tagged Android Open Source Project mirror release, while the vLLM references are maintained project documentation. Verify the behavior and available options for the versions you actually run.
Quick Recap
Product prices and availability are accurate as of the date/time indicated and are subject to change. Any price and availability information displayed on Amazon at the time of purchase will apply.




