Benchmark a representative agent workload against a documented inference-serving setup, warm up the service, and increase concurrent load until throughput levels off. Report total system output tokens per second (TPS), latency, concurrency, and the full configuration. If you divide TPS by the GPU count, label it a per-GPU average—not single-GPU performance or scaling efficiency.
What to measure—and what “per GPU” means
Inference throughput is the amount of model output a serving system produces over time. For an AI agent, the result depends not just on the GPU but also on the model, serving software, batching and parallelism settings, request mix, and the agent’s pattern of turns and tool use. A useful benchmark therefore reports the whole system and workload, not just a tokens-per-second figure.
As an Amazon Associate I earn from qualifying purchases.
NVIDIA defines total system TPS as output-token throughput across simultaneous requests. Its AIPerf definition calculates output tokens over the interval from the first request to the final response; configured warm-up can be excluded. If the system produces T output tokens per second across G GPUs, the simple normalized figure is T ÷ G TPS per GPU. Keep T and G beside that average.
The Tool Desk
Outbyte Driver Updater FREEFix the driver behind crashes, sound loss and screen glitchesFind Drivers →Outbyte PC Repair FREERepair Windows errors before they cause bigger problemsFix Now →This division is useful for a rough comparison of similarly configured systems, but it does not measure what one GPU would achieve alone. Multi-GPU parallelism, communication, batching, and system design affect the aggregate result. It is also not scaling efficiency: that would require comparing performance at different GPU counts under an appropriately controlled setup.
#1 Best Overall

- System Compatibility Note: This 2-slot card measures 271 x 112 x 39 mm and requires a single 12V-2x6-pin power connector. Please verify chassis and PSU compatibility before purchase.
- Dedicated Support: Please contact us directly through Amazon for any product questions or assistance you may require.
- Professional Intel Arc Pro B70 GPU: Built on the Intel Xe2-HPG architecture, it features 32 Xe cores and 256 XMX engines, designed to accelerate AI, rendering, and complex visualization workloads.
- Massive 32GB GDDR6 VRAM: Equipped with 32GB of high-speed GDDR6 memory on a 256-bit bus, running at 19 Gbps, which allows for handling large AI models and complex datasets locally.
- High-Performance Engine Clock: Delivers an engine clock of 2540 MHz, providing the compute power needed for demanding professional applications and AI inference.
Build a workload that resembles your agent
Start by describing the requests the inference service actually receives. A short, fixed prompt and response may be convenient, but it can miss the variable context and repeated generations of an agent session.
Capture the workload shape
- Model and tokenizer: record the model name and version and the tokenizer used to count tokens.
- Input and output lengths: record their distributions, not only a single average. Include how input context grows across turns.
- Turns and tools: record the turn-count distribution and the tool-use pattern. If representative multi-turn or coding/tool traces are available, use them or derive a documented workload profile from them.
- Generation settings: document decoding and sampling settings so another run does not silently use a different generation workload.
The September 28, 2026 AgentPerfBench preprint argues that single-turn chat tests and fixed input/output lengths can miss realistic agent workloads. It describes profiles based on empirical per-turn input length, output length, and turn-count distributions, and argues for testing load through hardware saturation. Treat those recommendations as recent research, not a universal benchmark standard. The authors report more than 3,000 benchmark results and more than 140,000 per-kernel Nsight Compute profiling records across four GPU platforms and 11 model architectures; those are figures reported by the preprint’s authors.
Rank #2

- NVIDIA Volta GV100 Architecture — 4,608 CUDA Cores, 640 1st-Gen Tensor Cores delivering 14 TFLOPS FP32 and 112 TFLOPS deep learning performance for AI training, inference, HPC, and scientific computing workloads
- 32GB HBM2 ECC Memory — 900 GB/s Bandwidth — High-bandwidth memory on a 4096-bit bus with ECC error correction provides the memory capacity and throughput required for the largest AI models, simulations, and datasets
- PCIe 3.0 x16 Interface — 250W TDP — Standard PCIe Gen3 connectivity with passive cooling designed for enterprise rack server deployment in HPE ProLiant, Dell PowerEdge, and Supermicro platforms with adequate chassis airflow
- NVLink — Scale to 96GB Unified Memory — Connect two V100 GPUs via NVLink at 300 GB/s bi-directional bandwidth to scale GPU memory from 32GB to 96GB for larger AI training and HPC workloads
- Multi-Precision Computing — Supports FP64 (7 TFLOPS), FP32 (14 TFLOPS), FP16 (112 TFLOPS) and INT8 precision modes for flexible deployment across training, inference, and scientific simulation workloads
Fix and document the serving configuration
Keep the serving stack constant when comparing runs. Record the GPU model and count, serving engine and version, precision or quantization, parallelism and batching settings, model-serving configuration, and network placement. Also record the concurrency or request-arrival policy and the measurement duration or interval used by the tool. A change in any of these can change both throughput and latency.
Do these 3 things before closing this tab:
1Fix the driver behind crashes, sound loss and screen glitches2Clear out junk files and repair common Windows errors3Scan for outdated or missing drivers - takes under a minuteNVIDIA documents AIPerf as a client-side benchmarking tool for OpenAI-compatible inference services. Its guide recommends placing the client on the same host when network latency is not part of the test. If client and server are on different hosts, report that arrangement: end-to-end latency can include network time, so the result is not directly equivalent to a same-host run.
Rank #3

- Powered by Radeon AI PRO R9700 - Supercharge you workflow with the cutting-edge RDNA 4 Architecture and 2nd-gen AI Accelerators.
- 32GB GDDR6 with 256-bit memory bus - Tackle larger, more complex projects without limits.
- PCIe Gen 5 - Unlock lightning-fast data transfers with PCIe Gen 5 support.
- GIGABYTE TURBO Fan Cooling System - Indented metal cover and blower fan increase airflow intake, while the vapor chamber, all copper heat sink, and metal frame offer efficient heat dissipation. Optimized airflow design allows for easy multi-GPU scalability.
- Double Ball Bearing Fan - Delivers superior heat resistance and rotational efficiency for better performance and a longer lifespan compared to conventional sleeve fans.
Run a warm-up and sweep the load
- Start the service with the configuration you intend to compare. Save the model, serving, and hardware settings. Do not change them midway through a sweep.
- Warm up the service before collecting measured results. AIPerf’s documented example includes a warm-up before its sweep. Preserve the tool’s configuration and the warm-up settings with the results.
- Run a concurrency sweep. Test representative deployment loads, then increase concurrency far enough to observe whether throughput levels off. NVIDIA advises using concurrency for most benchmarks and notes that throughput can saturate while latency continues to rise.
- Save the run artifacts. AIPerf’s example exports JSON and CSV results and includes a latency-throughput plot. Preserve the artifacts and the command or configuration used to generate them so the run can be checked or repeated.
Do not report only the best-looking load point. Concurrency and request rate both control offered load; state which policy you used. A throughput number without its load and latency can conceal whether the system delivered a useful response time or was already queueing heavily.
Report the metrics together
Use a metric set that shows aggregate capacity and the experience of an individual request. Definitions can vary between tools, so identify the implementation and do not assume identically named metrics are interchangeable.
Rank #4
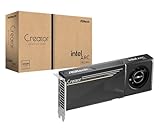
- System Compatibility Note: 2-slot card, 271x112x39mm, single 8-pin power, 200W TDP. Verify chassis clearance and PSU capacity before purchase.
- Dedicated Support: Please contact us directly through Amazon for any product questions or assistance you may require.
- 24GB GDDR6 on 192-Bit Bus: Massive 24GB memory with 456 GB/s bandwidth – ideal for LLMs, AI inference, 3D rendering, and generative design.
- Intel Xe2-HPG Architecture: Built on Intel's next-gen architecture with 20 Xe cores and 160 XMX engines for AI acceleration (197 INT8 TOPS).
- PCIe 5.0 Support: PCI Express 5.0 x16 interface for maximum bandwidth with the latest workstation platforms.
| Metric | What it describes | How to interpret it |
|---|---|---|
| Total output tokens per second (TPS) | Aggregate output-token throughput across simultaneous requests. AIPerf measures output tokens over the interval from the first request to the final response; configured warm-up can be excluded. | Report this as system throughput, along with the GPU count and load. |
| TPS per user | A single-client perspective: output sequence length divided by end-to-end latency for a request. | Do not confuse it with aggregate system TPS. |
| Time to first token (TTFT) | Time from query submission until the first received output token, when the response contains content. | Shows how long a user waits before generation begins. |
| Inter-token latency (ITL) or time per output token (TPOT) | Average time between consecutive output tokens. | Check whether the tool includes TTFT in its definition; AIPerf excludes it. |
| End-to-end latency | Time from query submission until the complete response, including queueing, batching, and network latency. | Relate it to the deployment’s response-time requirement. |
| Requests per second (RPS) | Successful requests completed per second over the benchmark interval. | Useful beside TPS when comparing workloads with different response lengths. |
Include averages and relevant tail percentiles when the tool provides them, and say which statistics you report. For agent workloads, distinguish a model-serving measurement from a full agent-task measurement: the latter may include orchestration and tool interactions, while the inference metrics describe requests to the model service. State what is inside the timed path rather than treating the two scopes as interchangeable.
Outdated Drivers Are Slowing You Down
One free scan finds every outdated or missing driver and matches the right update for your exact hardware.Free scan · exact hardware matchWindows Errors? Fix Them Before They Spread
Repair common Windows errors and clear accumulated junk for a smoother, more stable PC - no reinstall needed.Free scan · no reinstallChoose a useful operating point
Plot a user-facing latency metric against total system TPS, with each point labeled by concurrency. TTFT, ITL, end-to-end latency, or TPS per user can serve as the latency axis, depending on the question. Choose the point that meets the deployment’s latency budget, then report its throughput and load. The top TPS point alone is not necessarily useful if it comes with unacceptable latency.
Best Value

- Professional AI & Creator Workstation: AMD Radeon AI PRO R9700 GPU with 32GB GDDR6 is engineered for AI development, professional content creation, and compute-intensive workloads.
- Massive 32GB Memory Capacity: 32GB of GDDR6 memory on a 256-bit bus provides ample bandwidth for large AI models, 8K video editing, and complex 3D rendering.
- Advanced RDNA 4 with AI Accelerators: 64 Compute Units with 3rd Gen Ray Tracing and dedicated 2nd Gen AI Accelerators for groundbreaking AI performance and visual computing.
- Professional Blower Cooling: Efficient single blower design exhausts heat directly out of the chassis, ideal for multi-GPU workstation and server configurations.
- Enterprise-Grade Thermal Solution: Vapor chamber heatsink with industrial Honeywell PTM7950 thermal interface material ensures reliable cooling under sustained professional loads.
Normalize and compare without overstating the result
For each run, retain the total-system figure and configuration. If a per-GPU average helps the reader, show the arithmetic explicitly, for example: system TPS ÷ GPU count = average TPS per GPU. Do not omit GPU type, GPU count, or parallelism configuration next to the result, and do not describe the quotient as a single-GPU benchmark.
Before comparing GPUs or serving systems, align these dimensions or disclose the differences:
- Model and model version, tokenizer, and generation settings.
- GPU model and count, plus parallelism configuration.
- Serving framework and version, precision or quantization, and batching settings.
- Input/output length distributions, agent turn counts, and tool-use pattern.
- Concurrency or request-arrival policy and measurement interval.
- Latency metric, target, and whether the client’s network path is included.
- Total-system throughput, any per-GPU calculation, and the load point at which each result was obtained.
Standardized evaluations and deployment-specific tests answer different questions. MLPerf offers standardized inference evaluations across model architectures and scenarios; a trace-based workload can better reflect a particular agent deployment. Neither a custom result nor a standardized submission should be generalized beyond its stated workload and system.
For example, NVIDIA reports up to 3.7× higher throughput for Vera Rubin NVL72 than GB300 NVL72, and 99% scaling efficiency for a 288-GPU GB300 NVL72 submission, as vendor-reported MLPerf Inference v6.1 results retrieved from MLCommons on September 16, 2026. Those figures describe the named submitted systems and workloads; they are not a general GPU comparison or a conversion formula for an agent workload.
Keep backend metrics identifiable
AIPerf’s server-metrics reference maps throughput, latency, queue, and cache metrics across Dynamo, vLLM, SGLang, TensorRT-LLM, and Triton. When reporting server-side counters, preserve the backend-specific metric names and definitions. Similar labels do not establish that two backends measure the same interval or event.
Quick Recap
A compact report format
A reproducible report can use this structure:
- Workload: model/version and tokenizer; input/output length distributions; turns, context growth, and tool pattern; generation settings.
- System: GPU model/count; serving engine/version; precision or quantization; parallelism and batching; client placement.
- Procedure: warm-up configuration; concurrency or arrival policy; sweep values; measured interval; saved tool configuration and artifacts.
- Results: total TPS and RPS; TTFT, ITL/TPOT, and end-to-end latency with stated summary statistics; concurrency for each point.
- Normalization: if shown, total TPS divided by GPU count, explicitly labeled a per-GPU average and presented beside the total.
Product prices and availability are accurate as of the date/time indicated and are subject to change. Any price and availability information displayed on Amazon at the time of purchase will apply.




