Neither option is universally cheaper. Renting GPUs is usually the better financial choice for pilots, uncertain demand, bursty traffic and multi-region delivery because you can stop capacity and avoid buying hardware. Owning inference servers can produce a lower delivered cost when workloads run at high, predictable utilization for several years and your organization already has suitable power, cooling, space, networking and operations staff.
The only reliable comparison is the cost of serving your target workload: model quality, latency, concurrency and tokens delivered. A GPU-hour price by itself is not an inference cost.
As an Amazon Associate I earn from qualifying purchases.
Compare delivered inference, not GPU-hour stickers
Define one workload before comparing providers or servers. Record the model and version, precision or quantization, input-to-output token ratio, target latency, concurrent requests, uptime, deployment region and expected monthly tokens. Measure throughput at that latency and concurrency; a configuration that is cheap per hour but too slow for the service is not cheaper in practice.
Use this common metric:
Cost per million delivered tokens = (all monthly costs ÷ monthly tokens actually served) × 1,000,000.
#1 Best Overall
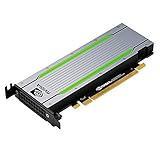
- Video/Sound Cards
- Passive Cooling
For request-based systems, calculate cost per request as well, because request lengths can vary dramatically. Report low, expected and high utilization cases. A single utilization assumption hides the main economic risk: owned accelerators continue to incur capital and operating costs while idle, whereas cloud instances can often be stopped.
What a cloud GPU bill really contains
Cloud pricing normally starts with an accelerator or instance rate, but production inference adds other line items:
- GPU and host virtual-machine charges, including CPUs, memory and local networking.
- Persistent disks, object storage, snapshots and image-registry storage.
- Inter-zone or inter-region traffic, public egress and private-link charges.
- Managed inference, orchestration, observability and load-balancing fees.
- Technical support and any software license attached to the service.
- Commitment terms, reservation payments or the operational cost of handling interruptible capacity.
Idle capacity is the cloud’s main advantage for variable workloads. An autoscaling group can reduce the fleet when traffic falls, so you pay little or nothing for stopped accelerators (while retaining storage and other applicable charges). Scaling up later can be slower or impossible if a region has no capacity, so a cost model should include the minimum warm capacity needed to meet your latency objective.
Free tools Windows power users keep installed
One-click scans. No signup required.
Illustrative T4 rates and the trade-off between flexibility and price
Google Cloud lists the NVIDIA Tesla T4, a 16 GB GDDR6 inference accelerator, at $0.35 per GPU-hour on demand, $0.22 with a one-year commitment and $0.16 with a three-year commitment on its current pricing page. These are accelerator rates, not complete application costs; the host VM and other services still apply.
| Pricing mode | Listed T4 rate | What you gain | What you give up |
|---|---|---|---|
| On demand | $0.35 per GPU-hour | Maximum ability to scale down or change regions | Highest unit rate |
| One-year commitment | $0.22 per GPU-hour | Lower rate for a reasonably stable baseline | Payment obligation during periods of low demand |
| Three-year commitment | $0.16 per GPU-hour | Lowest listed T4 rate | Longest lock-in and greatest risk of technology or demand mismatch |
| Spot capacity | Discounts can reach 60–91% for most machine types and GPUs, according to Google Cloud | Potentially very low variable cost | Instances can be interrupted; applications need checkpointing, retry and capacity fallback |
Commitments make sense only for the portion of demand you can forecast. Reserve a baseline and leave unpredictable peaks on flexible capacity rather than committing the entire projected fleet. Spot capacity is appropriate for queueable or fault-tolerant work, not an interactive endpoint that must remain available without a fallback.
AWS describes its G4dn instances, powered by T4 GPUs, as “the lowest cost GPU-based instances in the cloud for machine learning inference and small scale training.” That positioning describes the instance family, not a guarantee that a particular region or workload will have the lowest delivered token cost.
Rank #2
- Original premium quality
- Item weight: 0.55 kg
- Size: Full-Height/Full-Length (FH/FL)
What owning an inference server adds to the bill
An on-premises comparison must amortize the complete service, not just the accelerator card. Include:
What’s actually slowing this PC down?
Pick the symptom - the matching free tool is one click away.
- The server chassis, GPU or GPUs, CPUs, memory, boot and inference storage, and high-speed interconnects.
- Top-of-rack switches, cabling, firewalls, load balancers and spare parts.
- Electricity for the server and the facility’s cooling overhead; use your actual tariff and power-usage effectiveness where available.
- Rack space, physical security, environmental monitoring and any construction or electrical upgrades.
- Vendor support, warranty extensions, replacement parts and maintenance contracts.
- System, platform and security labor, including patching, capacity planning, incident response and model deployment.
- Financing cost, taxes, insurance, downtime and the residual or resale value at refresh.
A GPU alone is not an inference platform. A Tesla T4, for example, still needs a compatible server, power delivery, cooling, storage, networking and support. If those capabilities already exist, their incremental cost may be small; if they do not, the server project can cost several times the card price.
Amortization method
Choose a useful life that matches your finance policy and expected refresh cycle. Spread the depreciable purchase price over that period, then add recurring annual operating costs. Divide by the hours the service is actually available, not merely the hours in a calendar year. A fleet running 20% of the time carries five times as much capital cost per busy hour as the same fleet running continuously, before electricity and staffing are considered.
| On-premises cost bucket | Measurement to collect | Common omission |
|---|---|---|
| Capital equipment | Invoice price, financing rate, useful life and residual value | Ignoring CPUs, memory, disks and networking around the GPU |
| Facility | Rack, power circuit, cooling and physical-security charges | Assuming spare floor space and cooling are free |
| Operations | Loaded labor hours for administration, security and incidents | Counting only the model engineer’s time |
| Reliability | Spare parts, support contract and expected downtime | Assuming a single server has cloud-like availability |
| Refresh | Replacement date, migration effort and resale value | Keeping an old accelerator’s original throughput assumption |
Generation and software efficiency can overwhelm the hosting decision
Tokens per second, supported context length, quantization quality and software optimizations often matter more than the rental-versus-ownership label. Compare complete systems at the same latency and answer quality.
NVIDIA’s vendor analysis illustrates the spread: it shows $4.20 per million tokens for Hopper HGX H200 and $0.12 per million tokens for Blackwell GB300 NVL72, with displayed GPU-hour figures of $1.41 and $2.65 respectively. Those figures are vendor analysis, not a universal market rate; verify the benchmark’s model, precision, batching, latency target and infrastructure assumptions before using them in a budget.
PC Slower Than It Used to Be?
A free scan shows the junk files, broken settings and background clutter dragging Windows down - then fixes them in one click.Free scan · Windows 10 & 11Crashes, No Sound, or Screen Glitches?
Random freezes, missing sound and display glitches usually trace back to one bad driver. Find and replace yours safely.Free scan · under a minuteAnother NVIDIA product page reports a B200 result of approximately $0.02 per million tokens versus $0.09 for H100 in an InferenceX benchmark as of April 2026. Treat that as a dated, vendor-reported benchmark rather than a promise for your application. A newer accelerator can cost more per hour yet deliver a lower token cost if its throughput advantage is large enough; an older card can still win when its purchase price is low and utilization is very high.
Rank #3

- NVIDIA Tesla T4 brings GPU Boost technology to boost performance of any application. Includes Error-Correcting-Codes (ECC) for protecting data reliability.
- PCI Express 5.0 host interface ensures dependable data transfer for maximum efficiency
- GDDR6 memory technology effectively enables data to be moved at various points in a CPU clock cycle to allow maximum productivity
- Plug-in Card form factor allows hassle-free and easy usage with increased efficiency
- Comes in 11.5" height for maximum productivity and easy carrying
Cloud prices vary by provider, region and availability
Never use one region’s quote as a global cloud price. A 2025 Cast AI benchmark reported that Google’s average price for an eight-A100 on-demand instance was 28% lower than AWS and 18% lower than Azure in the configurations it examined. The same report said region and availability-zone selection could change cost by as much as six times. Capacity, taxes, data-residency rules and network placement can therefore reverse a provider ranking for your deployment.
Lenovo’s 2026 total-cost study, with baseline costs stated as of December 23, 2025, compared equivalent Lenovo on-premises servers with AWS and GCP/Azure instances. Use such studies as a structure for your worksheet, then replace their assumptions with current quotes, your electricity rate, staffing cost and measured throughput.
How to calculate your own break-even point
- Freeze the workload definition. Specify model, quantization, token mix, latency percentile, concurrency, uptime, region and monthly input and output tokens.
- Benchmark throughput. Measure delivered tokens per second on each candidate cloud instance and on the proposed server. Keep batch size, software stack and quality settings equivalent.
- Build the cloud monthly total. Multiply GPU and host rates by active hours, then add storage, networking, egress, managed services, support and the cost of reserved or spot-capacity failure handling.
- Build the on-premises monthly total. Amortize the server and accelerator, add power, cooling, space, networking, maintenance, staffing, financing, downtime and refresh costs.
- Divide by delivered tokens. Use actual tokens served, not theoretical maximum throughput. Calculate cost per million tokens and cost per request.
- Run three utilization cases. Model low, expected and high busy-time percentages, plus a traffic spike case. Include the warm standby capacity required for availability.
- Solve for break-even. If cloud has a higher variable cost per token but on-premises has fixed monthly cost, the approximate break-even volume is: on-premises fixed monthly cost ÷ (cloud variable cost per token − on-premises variable cost per token). This equation is meaningful only when the denominator is positive and both options meet the same service target.
- Stress-test the assumptions. Recalculate with a different region, electricity tariff, accelerator price, refresh date, staffing level and throughput. Record which assumption changes the result most.
There is no defensible universal utilization threshold or payback period. Monthly token volume, latency target, hardware and server quotes, electricity, facilities, staffing, financing, region and uptime all move the answer.
Do these 3 things before closing this tab:
1Fix the driver behind crashes, sound loss and screen glitches2Repair Windows errors before they cause bigger problems3Scan for outdated or missing drivers - takes under a minuteWhich option fits common operating patterns?
| Situation | Usually preferable | Reason | Watch for |
|---|---|---|---|
| Prototype or pilot with unknown demand | On-demand cloud | No capital purchase and easy teardown | Unexpected egress, storage and managed-service charges |
| Bursty interactive traffic | Cloud autoscaling | Capacity follows demand instead of sitting idle | Cold-start latency and regional capacity shortages |
| Stable baseline with predictable growth | Committed cloud capacity or hybrid | Lower rate without owning every peak unit | Overcommitting before forecasts are reliable |
| High, steady utilization for several years | Evaluate on-premises seriously | Capital is spread across many busy hours | Refresh, outage and staffing costs |
| Strict data-residency or local-system latency | On-premises or a compliant local facility | Data stays near the application and policy boundary | Security, redundancy and facility investment |
| Global users in several regions | Multi-region cloud or hybrid | Places inference near users without buying fleets everywhere | Inter-region transfer and duplicated idle capacity |
| Interruptible batch jobs | Spot cloud or queued owned capacity | Work can retry after interruptions | Checkpointing and completion-time limits |
When a hybrid design is the lowest-risk answer
Run the forecastable baseline on owned servers or committed cloud capacity and send peaks, new-model trials and geographic overflow to flexible cloud instances. Route by queue depth and latency rather than by a fixed percentage. Keep model artifacts and telemetry portable, use identical containers where possible, and set an explicit egress budget. A hybrid plan only saves money if the baseline is large enough to keep owned capacity busy and the operational complexity does not require a second full platform team.
Practical controls that protect the estimate
- Tag every cloud resource by model, environment and team; review idle GPU-hours weekly.
- Set budgets and alerts for GPU, egress, storage and managed-service categories separately.
- Measure tokens per second, queue time, power draw and error rate continuously; feed observed values back into the cost model.
- Keep a capacity fallback for spot interruptions and a tested process for moving to another region.
- Benchmark quantized and full-precision variants at the same quality threshold before purchasing hardware.
- Include a refresh reserve so a three-year comparison does not assume the original accelerator remains competitive indefinitely.
- Price support and engineering labor at loaded cost, not salary alone.
Common mistakes and how to correct them
Comparing a GPU rental with a bare card
Correct the comparison by adding the cloud host and services on one side and a complete server, facility and operations stack on the other.
Using peak throughput as monthly output
Correct it with measured throughput at the required latency and the percentage of time requests are actually running.
Rank #4

- Hpe NVIDIA Tesla T4 16GB module
Assuming commitments are free discounts
Correct it by modeling the payment obligation during low demand and reserving only the forecastable baseline.
Recommended Free Tools
Treating spot capacity as guaranteed
Correct it with interruption probability, retry overhead, checkpoint storage and a fallback rate.
Ignoring model and generation changes
Correct it by rerunning the benchmark whenever quantization, context length, serving software or accelerator generation changes.
Declaring a winner from one region
Correct it with current quotes in every allowed region and the network path to users and data.
Bottom line
Choose cloud GPUs when flexibility, uncertain utilization, burst capacity or multi-region reach is worth more than the lowest theoretical unit rate. Choose on-premises servers only after a complete TCO model shows that your sustained token volume keeps the equipment busy and that you can absorb facilities, operations and refresh responsibilities. For many production systems, a committed cloud baseline plus burst capacity is the sensible middle ground. The winning option is the one with the lower measured cost per delivered token at your required latency and quality—not the one with the cheaper advertised GPU-hour.
Quick Recap
Product prices and availability are accurate as of the date/time indicated and are subject to change. Any price and availability information displayed on Amazon at the time of purchase will apply.




