Yes, you can start a prepared monitoring deployment with one command—but that command does not select, configure, secure, or connect every monitoring service for you. Docker Compose can start the services described in a YAML file. A practical self-hosted setup still needs separate choices for host metrics, application telemetry, endpoint checks, and any customer-facing status page, plus ongoing storage and security work.
What does “one command” mean for a self-hosted monitoring stack?
It means starting a configured group of services, not installing a universal monitor that automatically covers every job. Docker Compose uses a YAML configuration to define services, networks, and volumes, then creates and starts those configured services with a command.


As an Amazon Associate I earn from qualifying purchases.
For SigNoz, the current self-hosted Docker guide uses Foundry as its supported installation and management path. Foundry works from a declarative configuration and can provision infrastructure, install the backend, and configure OpenTelemetry collection. The documented launch command is foundryctl cast -f casting.yaml; the configuration file and Foundry setup must already be in place.
SigNoz says its legacy install.sh script and repository-bundled Compose files are deprecated as of v0.130.0. For a direct Compose workflow, its guide describes validating with gauge, rendering with forge, and then starting services with docker compose up -d. These are vendor-documented workflows, not a claim that every monitoring component below is included in one SigNoz deployment.
Which components cover servers, logs, APM, uptime, and status pages?
| Need | Documented component or approach | What it does—and what it does not establish |
|---|---|---|
| Logs, metrics, traces, and APM-style observability | SigNoz with OpenTelemetry collection via Foundry | Provides an observability backend and collection setup. Host monitoring and a public status page are separate jobs, not demonstrated as included in this deployment. |
| Server or host monitoring | Beszel hub plus a separately configured agent on each system | Monitors systems through its hub and agents. Its getting-started flow does not make it the same setup as SigNoz’s application telemetry pipeline. |
| Endpoint availability checks | OpenTelemetry Collector HTTP Check Receiver feeding metrics to SigNoz | Checks from the Collector host’s network perspective; it is not inherently an external, multi-region check or a customer-facing status page. |
| Customer-facing status page | Uptimepage | Its project documents a built-in /status page. A public deployment needs hardening; the project’s quick-start Compose example is for trying it out, not direct public exposure. |
| Error and exception tracking | GlitchTip self-hosted installation | Can be considered as a separate supplement if exception tracking is needed. Its deployment requires configuration and is not part of the SigNoz deployment. |
How do you launch the observability backend?
-
Install
foundryctlusing SigNoz’s current self-hosted Docker guide. The guide presents Foundry, rather than the deprecated legacy script or bundled Compose files, as the supported path. -
Create a
casting.yamlconfiguration targeting Docker Compose. This is where the declarative deployment is defined; the launch command does not replace this configuration work.Quick wins for a faster PC:
Fix the driver behind crashes, sound loss and screen glitchesFind Drivers →Clear out junk files and repair common Windows errorsFree Scan →Scan for outdated or missing drivers - takes under a minuteDriver Scan →Special offer. See more information about Outbyte and uninstall instructions. Please review EULA and Privacy policy. -
Run
foundryctl cast -f casting.yaml. Foundry’scastflow checks the environment, generates Compose files, and starts the services.
SigNoz documents a minimum of 4 GB of memory for its Docker stack. The guide warns that containers may restart if Docker lacks enough memory. Its stated default retention is 7 days for logs and traces, and 30 days for metrics; these defaults can be changed in settings. The documentation does not give a universal sizing formula, so actual capacity depends on workload and retention choices.
Rank #3

- COMPATIBILITY: Specifically designed for the Raspberry Pi Compute Module 5 (CM5) - supports up to four CM5 modules simultaneously. Important note: Not compatible with CM4
- FORM FACTOR AND MOUNTING: Standard Mini-ITX form factor, ideal for mounting in a 10-inch rack; You can use this case (ASIN B0HCH1PY5H) to mount the unit in a 10-inch server cabinet.
- POWER SUPPLY AND MANAGEMENT: Dual 12-20V power input with redundancy for increased reliability, independent power control for all four channels, integrated E/S/P/32 chip enables remote management of the entire cluster
- NETWORKING AND STORAGE: Each channel features 2.5 GbE + 1 GbE network ports, M.2 M-Key 2280 NVMe support for each CM5 module, extended GPIOs and USB 2.0 programming port for eMMC management
- MONITORING AND PACKAGE CONTENTS: Integrated voltage and current monitoring with INA3221 x2 sensors, package includes 1x DeskPi Super4C board and 1x DC 19.0V 4.73A power supply
For the specific Windows issue described in the guide—ClickHouse Keeper exiting with code 139 under Docker Desktop’s virtualization layer—SigNoz recommends native Docker Engine in WSL 2. That note concerns the described issue and should not be generalized to every Windows deployment.
How do you add server monitoring?
Beszel’s documented setup separates the hub from the systems being monitored. Start the hub using its Docker/Podman deployment or single binary, then add and configure an agent for each system. For a local Docker setup, its guide provides a socket-based agent configuration; for remote systems, the web UI supplies agent instructions.
The Tool Desk
Outbyte PC Repair FREEClear out junk files and repair common Windows errorsFree Scan →Outbyte Driver Updater FREEScan for outdated or missing drivers - takes under a minuteDriver Scan →Rank #4

- INA226 IIC I2C Bi-Directional Current Monitoring Sensor
- Can be applied to Servers, Telecom Equipment, Power Management, Battery Chargers and Power Supplies
- High accuracy, 16 programmable addresses, 10-Pin, DGS (VSSOP) Package
The Linux install script applies to Linux only; other operating systems need their matching binary. Treat Beszel as the host-monitoring component in this plan, not as proof that logs, application traces, exceptions, or public uptime pages are covered by it.
Independent reader supportYour contribution helps us test, update, and keep practical guides available for everyone.How do you check endpoint availability?
SigNoz’s HTTP endpoint approach uses an OpenTelemetry Collector HTTP Check Receiver on a schedule. The guide’s example interval is 60 seconds and suggests 30 seconds for critical endpoints. These are configuration examples, not uptime guarantees. The default measurements are httpcheck.status, httpcheck.duration, and httpcheck.error; TLS certificate time remaining, response size, and phase timings require additional enablement.
Best Value
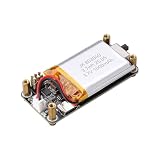
- Uninterrupted Power Supply: Automatically switches to battery power when external power is disconnected, ensuring your Raspberry Pi Zero keeps running without interruption
- Real-Time Battery Monitoring: Built-in INA219 chip provides accurate readings of voltage, current, power, and remaining battery capacity via I2C interface
- Plug-and-Play Design: No soldering required; uses a 2x3P pin header for easy and secure connection to all Raspberry Pi Zero models
- Integrated 1000mAh Li-ion Battery: Supports 3.7V 803040 lithium battery with built-in protection against overcharge, over-discharge, and short circuits
- LED Status Indicator: Visual charging status with blinking during charging, solid when charging, off when fully charged or on battery mode
The check runs from the Collector host. If the Collector is inside the same network as the monitored service, the result reflects internal reachability. For a user-facing availability perspective, SigNoz advises placing the Collector outside the endpoint’s hosting network. This remains a check from that Collector’s location, not a multi-region external monitoring service.
What’s actually slowing this PC down?
Pick the symptom - the matching free tool is one click away.
Keep the receiver and its uptime resource processor out of an application-metrics pipeline: SigNoz cautions that combining them there can change service-name attribution.
Can the setup publish a customer-facing status page?
Uptimepage documents a customer-facing status page at /status, but it is a separate component to deploy and connect to your monitoring workflow. The repository’s quick-start Compose example starts the monitor with Postgres and ClickHouse, bootstraps an owner, and serves a local dashboard. The same repository warns that this trial setup has no TLS or front-end authentication and exposes database ports. Do not expose that quick start directly to the public internet; harden the deployment before making a status page public.
What must be planned beyond the launch command?
- Service boundaries: Decide which components collect host metrics, application telemetry, endpoint checks, and public status information. A successful Compose start does not itself connect those different jobs.
- Security: Review public network exposure, authentication, TLS, and secrets before making any service accessible outside a trusted environment. The Uptimepage quick start is explicitly not hardened for public exposure.
- Storage and retention: Account for the telemetry kept and the retention settings you choose. SigNoz’s documented defaults are not a guarantee that a given disk or server will suit every workload.
- Lifecycle: Plan how you will back up persistent data, update services and configuration, and recover from failures. Compose starts the defined services; it does not remove the operator’s maintenance responsibilities.
- Probe viewpoint: Place endpoint checks where their network perspective matches the question you need answered. An internal probe can show internal reachability without proving that an outside user can reach the service.
GlitchTip is a possible separate addition when error and exception tracking is needed. Its official installation guidance describes Docker Compose on a single server and strongly recommends SSL; it is not a substitute for configuring the host, logs, APM, endpoint, and status-page components above.
Quick Recap
Product prices and availability are accurate as of the date/time indicated and are subject to change. Any price and availability information displayed on Amazon at the time of purchase will apply.
Free tools Windows power users keep installed
One-click scans. No signup required.




