Do these 3 things before closing this tab:
1Repair Windows errors before they cause bigger problems2Scan for outdated or missing drivers - takes under a minute3Clear out junk files and repair common Windows errorsThe best website optimization tool depends on what you need to improve. Use PageSpeed Insights to check real-user performance when Chrome User Experience Report (CrUX) data is available and to inspect Lighthouse diagnostics; use WebPageTest when you need a deeper speed investigation. For search visibility, choose an SEO tool based on whether you need broad SEO and content capabilities, backlink and keyword research, or Google’s own search-performance data. Cloudflare belongs in a separate category: it can help you compare delivery conditions, but it is not a standalone diagnostic test.
This comparison covers eight tools and services substantiated for these jobs. It does not rank them on one scale: a lab test, an SEO suite, and delivery infrastructure do different things.

As an Amazon Associate I earn from qualifying purchases.
What are the best website optimization tools?
For most sites, start with PageSpeed Insights (PSI). It brings together field data from real Chrome users, when available, and lab results generated by Lighthouse. If the lab report points to a problem that needs closer investigation, use a diagnostic tool such as WebPageTest. Add an SEO platform or a delivery service only when you have that specific need.
Windows Errors? Fix Them Before They Spread
Repair common Windows errors and clear accumulated junk for a smoother, more stable PC - no reinstall needed.Free scan · no reinstallOutdated Drivers Are Slowing You Down
One free scan finds every outdated or missing driver and matches the right update for your exact hardware.Free scan · exact hardware match| Tool or service | Best-fit job | What the available evidence establishes |
|---|---|---|
| PageSpeed Insights | Review field performance and Lighthouse lab diagnostics | Google documents the distinction between real-user CrUX data and simulated Lighthouse results, as well as field-data availability and Core Web Vitals thresholds. Google PSI documentation. |
| Lighthouse | Run lab diagnostics | Google says PSI uses Lighthouse to generate lab data in a simulated environment. A lab result is not a substitute for field experience. Google PSI documentation. |
| WebPageTest | Investigate speed in greater depth | Recommended here as a diagnostic tool for deeper investigation; no specific test settings or feature comparison are established in the available sources. |
| GTmetrix | Consider as another speed-testing option | Named as a speed-testing tool in a comparison source; the available evidence does not establish a current feature-by-feature comparison with PSI or WebPageTest. |
| Semrush | Broad SEO and content work | A 2026 TechRadar roundup describes it as offering a broad collection of SEO and content features. That is a secondary-source characterization, not a verified current feature inventory. TechRadar’s SEO-tool roundup. |
| Ahrefs | Backlink and keyword research, competitor analysis, and audits | These are the use cases described in the same TechRadar roundup; check the vendor for current product details. TechRadar’s SEO-tool roundup. |
| Google Search Console | Google search-performance data | The TechRadar roundup identifies it as a free SEO service. This comparison does not establish further current feature or setup details. TechRadar’s SEO-tool roundup. |
| Cloudflare | Compare performance with and without its proxy | Cloudflare documents a controlled testing sequence for evaluating its proxy and warns that the first enabled test may include uncached results. Cloudflare speed-testing documentation. |
Tool choice should follow the problem. A speed test measures performance under particular conditions; an SEO suite supports search research and audit work; Cloudflare changes delivery conditions that you can test. They are not interchangeable, and a single score cannot fairly rank all three.
#1 Best Overall
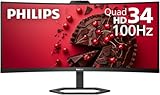
- EXPAND YOUR HORIZONS: 3440 x1440 UltraWide QHD (WQHD) resolution with 21:9 aspect ratio for efficient productivity
- CURVED IMMERSION: The 1500R radius curved VA panel allows for more immersion and better color accuracy. It can also help alleviate eye strain during long hours of working
- RICH COLORS FOR WORK AND PLAY: Ultra Wide-Color technology produces true-to-life images and a wider spectrum of colors with sRBG 123.24 percent , NTSC 99.25 percent color gamut area coverage
- WINDOWS HELLO WEBCAM WITH NOISE-CANCELING MIC: Comes with built-in 5MP webcam, noise canceling microphone, and speakers, perfect for remote working. The webcam is equipped with advanced sensors for Windows Hello facial recognition, which conveniently logs you into your Windows devices in less than 2 seconds
- ONE CABLE IS ALL YOU NEED: USB-C docking transfers high-speed data, high-resolution video signal, and power to your laptop (up to 65W of Power Delivery support) via a single USB-C cable. Play and work in high resolution while simultaneously charging your notebook
Which website speed test should I use?
Start with PageSpeed Insights for field context
PSI reports two different kinds of evidence. Field data comes from real Chrome user experiences in CrUX, while lab data is generated using Lighthouse in a simulated environment. Field data describes users’ experience over time; lab data helps investigate a test run under controlled conditions. Google explains the distinction in its PSI documentation.
CrUX field data uses a trailing 28-day collection period and reports metrics at the 75th percentile. URL-level data can be absent when there are not enough samples; PSI may then fall back to origin-level data. Check whether the report is showing URL or origin data before treating it as a page-specific result. These details are documented by Google.
Rank #2
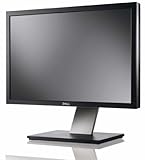
- Dell UltraSharp U2410 - LCD display - IPS- 24" - widescreen - 1920 x 1200 / 60 Hz
Use Lighthouse results to investigate, not to predict every visitor’s experience
A Lighthouse score is a lab diagnostic, not a direct measurement of all visitors’ experience. Google cautions that “Good lab data does not necessarily mean real-user experiences will also be good.” If field and lab results differ, that does not automatically mean one is wrong: they describe different evidence and conditions. Google PSI documentation.
Free tools Windows power users keep installed
One-click scans. No signup required.
Move to a deeper test when the first report is not enough
Use WebPageTest when you need a deeper speed investigation than an initial PSI review provides. GTmetrix is another named speed-testing option, but the available comparison evidence does not establish a current, apples-to-apples feature breakdown between it and the other tools. If PageSpeed Insights and GTmetrix show different scores, first check what each result measures and under what conditions rather than comparing the numbers as if they were the same test.
How do I improve Core Web Vitals?
Use PSI to identify whether the report has field data, lab data, or both, then treat each as evidence for a different step: field data shows whether real-user performance is meeting the thresholds, while lab diagnostics can help investigate what happened during a simulated test. Google’s documented “good” thresholds, assessed at the 75th percentile, are:
- Largest Contentful Paint (LCP): 2.5 seconds or less.
- Interaction to Next Paint (INP): 200 milliseconds or less.
- Cumulative Layout Shift (CLS): 0.1 or less.
These thresholds and the 75th-percentile assessment are from Google’s PSI documentation. If a URL has insufficient CrUX samples, its own field result may be unavailable and PSI may show origin-level data instead; do not mistake that fallback for a URL-only measurement.
Rank #4
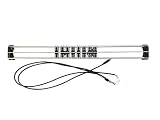
- Exclusively compatible with N scale locomotives, this test stand works with most standard N gauge models, making it a flexible and practical addition to any hobbyist’s collection.
- With a straightforward structure and simple connection design, the rolling test stand can be assembled and put into use quickly without complicated tools or procedures.
- Manufactured from premium metal materials, the test bench offers excellent stability and wear resistance, ensuring reliable performance even with frequent daily use.
- This dedicated test treadmill lets you safely debug, test speed and inspect locomotive performance, greatly upgrading the fun and professionalism of your model train hobby.
- This is not a toy. Not intended for use by children under 14.
- Open PageSpeed Insights and inspect the page. Note whether field data is present and whether it is reported for the URL or the origin.
- Compare available field metrics with the Core Web Vitals thresholds above. Use the field results to understand real-user performance rather than treating a lab score as the user outcome.
- Review the Lighthouse lab diagnostics for possible issues to investigate. Treat them as diagnostic clues from a simulated test, not proof that the same result applies to every visitor.
- If the initial diagnostics do not answer the question, run a deeper investigation with a tool such as WebPageTest.
- After making a change, measure again under comparable conditions. Use field data to assess real-user outcomes when it is available; a new lab result alone does not establish how users experienced the change.
Why does PageSpeed Insights show a different score from GTmetrix?
A score comparison only makes sense if both tools are measuring the same kind of data under comparable conditions. PSI may show CrUX field data and Lighthouse lab diagnostics, which are not equivalent. A lab test is simulated; field data reflects a trailing 28-day window of real Chrome user experiences. The available sources do not provide a current GTmetrix-versus-PSI methodology comparison, so a difference in scores cannot be attributed to a specific GTmetrix setting here.
For a useful comparison, record which report and metric you are looking at, whether it is field or lab data, and whether the test conditions match. Compare the underlying diagnostics and metrics rather than assuming the headline scores are interchangeable.
Best Value
Which SEO tool is right for my website?
Choose by the search task you actually need to perform. A broad SEO and content suite is different from a tool selected for backlink or keyword research, and both differ from a service focused on Google search-performance data.
- Consider Semrush if you want a broad collection of SEO and content capabilities. TechRadar’s roundup describes it this way, but consult the vendor for current feature details. TechRadar’s roundup has inconsistent year wording—a 2026 title and a “best SEO tools of 2025” subheading—so it should not be treated as a clean, current ranking.
- Consider Ahrefs if your needs include backlink and keyword research, competitor analysis, or audits, the use cases identified in the same roundup. Confirm current capabilities directly with the vendor before choosing a plan.
- Consider Google Search Console if you need the Google search-performance service identified as free in that roundup. The evidence here does not establish detailed current capabilities, so check Google’s own documentation for the task you have in mind.
Do not choose a paid SEO suite merely because it appears in a roundup. First identify whether the gap is search-performance visibility, keyword or backlink research, competitor analysis, or broader SEO and content work; then verify that the product’s current offering covers that need.
When should you test Cloudflare separately?
Cloudflare is delivery infrastructure, not simply another score-producing diagnostic. Its documentation describes a controlled comparison to assess performance with and without its proxy: pause the proxy, test, re-enable it, test again, and repeat to establish a baseline. Cloudflare notes that the first test with the proxy enabled may include uncached results, so a single run can mislead. See Cloudflare’s speed-testing instructions, last updated April 20, 2026.
Cloudflare also says it does not consider Time to First Byte (TTFB) the most important measure of page-load speed. Read TTFB alongside the rest of the page’s performance evidence rather than treating it as the sole verdict. Cloudflare Fundamentals documentation.
Quick Recap
Build a simple measurement-to-action workflow
- Measure the user-facing outcome: Begin with PSI and note the presence, scope, and result of CrUX field data.
- Diagnose the test: Inspect Lighthouse lab diagnostics, remembering that a simulated result and real-user field data answer different questions.
- Investigate further only when needed: Use WebPageTest for deeper speed investigation; avoid treating unrelated tool scores as a uniform ranking.
- Choose a separate SEO or infrastructure tool only for its job: Use an SEO service for search tasks and Cloudflare’s documented comparison workflow to evaluate proxy delivery conditions.
- Verify the change: Re-measure after changes and keep test conditions comparable. A lab score can help with diagnosis, but field evidence is needed to assess real-user experience when it is available.
Product prices and availability are accurate as of the date/time indicated and are subject to change. Any price and availability information displayed on Amazon at the time of purchase will apply.




