Freedom251 › Data Visualization Software
Visualis
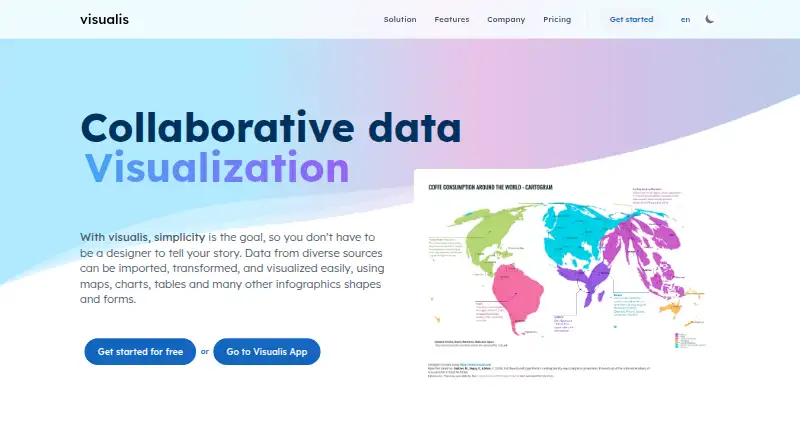
What Visualis is
Visualis is a web service for creating, enriching, and sharing data stories with maps, charts, tables, and infographic shapes. Data can come from CSV uploads, an external spreadsheet link, clipboard pasting, or direct keyboard entry. Filters, grouping, and pivoting help prepare the data before visualization. The editor provides six interactive map types: choropleths, proportional symbols, link connections, gridded points, hex-bins, and cartograms. It also lists 20 or more customizable chart types, including lines, bars, areas, radial areas, pyramids, bullets, Gantt, Voronoi treemaps, and quadrant charts. Components can be styled with colors, ramps, strokes, fonts, and filter effects, then annotated. Visualizations can be shared with team members and exported as PDF, PNG, SVG, HTML, or Gzip; the Free plan specifies PNG export. Free is for individuals and includes three uploaded datasources. Teams adds collaboration, more datasources and formats, and removes the watermark. Visualis identifies itself as a product of AppGis Inc., incorporated in Canada on 2020-09-18.
Who it suits
Visualis suits individuals and teams turning spreadsheet or CSV data into shareable visual stories. It is useful for users who need interactive maps, varied charts, styling, annotations, and export options in a browser.
What it does well
- Accepts CSV, spreadsheets, clipboard, and keyboard data
- Six interactive customizable map types
- 20 or more customizable chart types
- Filters, grouping, and pivoting for preparation
- Free plan includes three uploaded datasources
What to know first
- Free plan is for individuals
- Free plan specifies PNG export
- Teams is needed to remove the watermark
Plans
| Plan | Billed and limits | Price |
|---|---|---|
| Free | For individuals · Create and publish visualizations · 3 uploaded datasources · PNG export | Free |
| Teams | For professionals and teams · Free plan features · Collaboration · More datasources and export formats · No watermark · Price not displayed on the opened pricing page | On request |
As visualis.one lists them, read 11 Oct 2026. The maker's own page has the final word.
Verdict
Visualis combines flexible data input, preparation tools, interactive maps, and many chart styles in a browser editor. The Free plan supports individual projects with three datasources, while Teams adds collaboration, formats, and watermark removal.
Facts from Visualis's own pages
- Account access
- The sign-up page offers email and password registration, and says passwords must be at least eight characters. · visualis.one, 11 Oct 2026
- Charts
- The site says Visualis offers 20 or more customizable chart types, including lines, bars, areas, radial areas, pyramids, bullets, Gantt, Voronoi treemaps, and quadrant charts. · visualis.one, 11 Oct 2026
- Data input
- Users can upload CSV data, link an external spreadsheet, paste from the clipboard, or type data directly. · visualis.one, 11 Oct 2026
- Data preparation
- Data can be transformed with filters, grouping, and pivoting. · visualis.one, 11 Oct 2026
- Data sources
- CSV files; external spreadsheets; clipboard; keyboard input · visualis.one, 22 Sept 2026
- Design
- Visualization components can be styled with colors, ramps, strokes, fonts, and filter effects, and can be annotated. · visualis.one, 11 Oct 2026
- Free plan
- Yes · visualis.one, 22 Sept 2026
- Free plan limit
- The free plan is for individuals and includes three uploaded datasources. · visualis.one, 11 Oct 2026
- Integrations
- The product page states that users can link an external spreadsheet; it does not name a spreadsheet provider there. · visualis.one, 11 Oct 2026
- Maker
- Visualis identifies itself as a product of AppGis Inc., incorporated in Canada on 2020-09-18; the opened pages do not state a headquarters location. · visualis.one, 11 Oct 2026
- Maps
- The site lists six interactive customizable map types: choropleths, proportional symbols, link connections, gridded points, hex-bins, and cartograms. · visualis.one, 11 Oct 2026
- Platform
- web · visualis.one, 22 Sept 2026
- Product
- Visualis is a web service for creating, enriching, and sharing data stories using maps, charts, tables, and infographic shapes. · visualis.one, 11 Oct 2026
- Security
- The opened product pages did not state security certifications or compliance claims. · visualis.one, 11 Oct 2026
- Sharing and export
- Visualizations can be shared with team members and exported as PDF, PNG, SVG, HTML, or Gzip; the free plan specifies PNG export. · visualis.one, 11 Oct 2026
- Teams plan
- The Teams plan is described as adding collaboration, more datasources and formats, and removal of the watermark. · visualis.one, 11 Oct 2026
Where Visualis stands on Freedom251
- Data Visualization Software#54 of 98