Freedom251 › Data Visualization Software
Sigma.js
What Sigma.js is
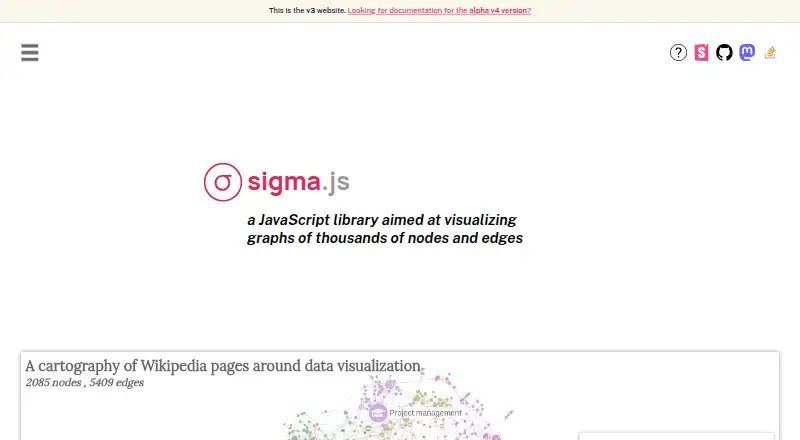
Sigma.js is a free, MIT-licensed JavaScript library for interactive graph visualization in web browsers. It uses GPU-accelerated WebGL to display graphs with thousands of nodes and edges, supporting pan, zoom, hover, and multi-touch interaction. The library requires Graphology as its graph data structure; CSV can be processed through Graphology before rendering. Sigma.js works with React, Angular, Vue, or vanilla JavaScript and can be installed through a CDN, npm, or Yarn. Its API accepts a Graphology graph, a DOM container, and optional settings, and the container must have defined width and height. Styles and primitives map graph attributes to visual properties. Companion packages add Leaflet and MapLibre layers, custom WebGL layers, node-rendering options, and image export. Layouts, metrics, and community detection come through Graphology’s standard library. A standalone browser bundle exists, while npm is recommended when tree-shaking matters.
Who it suits
Sigma.js suits developers building embedded, interactive graph views for exploration, network analysis, security analysis, or codebase visualization. It fits projects using Graphology and a web framework or vanilla JavaScript.
What it does well
- Free MIT-licensed library
- WebGL rendering for large graph displays
- Built-in pan, zoom, hover, and touch interactions
- Works with React, Angular, Vue, or vanilla JavaScript
- Companion packages add maps and image export
What to know first
- Requires Graphology graph data
- A sized container DOM element is required
- Browser bundle includes the whole library
- TypeScript-only exports are unavailable at runtime
Plans
| Plan | Billed and limits | Price |
|---|---|---|
| MIT-licensed open-source library | MIT License · browser graph visualization library | Free |
As sigmajs.org lists them, read 11 Oct 2026. The maker's own page has the final word.
Verdict
Sigma.js offers a focused browser library for interactive Graphology visualizations, with WebGL performance, framework support, and extensibility packages. Developers should prepare graph data and choose npm when production bundle size makes tree-shaking important.
Facts from Sigma.js's own pages
- Bundle limit
- The browser bundle documentation says the bundle includes the whole library and recommends the npm package when production bundle size matters because bundlers can tree-shake unused code. · sigmajs.org, 11 Oct 2026
- Companion packages
- Companion packages provide Leaflet and MapLibre map layers, custom WebGL layers, node rendering options, and image export. · github.com, 11 Oct 2026
- Compatibility limit
- The browser bundle documentation says TypeScript-only exports, including interfaces and type aliases, are unavailable at runtime. · sigmajs.org, 11 Oct 2026
- Customization
- The documentation says users can customize how graph attributes map to visual properties through its styles and primitives system. · sigmajs.org, 11 Oct 2026
- Dashboard type
- interactive · sigmajs.org, 23 Sept 2026
- Data sources
- Graphology graph data; CSV can be processed with Graphology before rendering · sigmajs.org, 23 Sept 2026
- Embedded dashboards
- Yes · sigmajs.org, 23 Sept 2026
- Frameworks
- The homepage says Sigma.js works with React, Angular, Vue, or vanilla JavaScript. · sigmajs.org, 11 Oct 2026
- Free plan
- Yes · sigmajs.org, 23 Sept 2026
- Graph algorithms
- Layouts, metrics, and community detection are available through Graphology’s standard library. · sigmajs.org, 11 Oct 2026
- Graph input
- The Sigma API takes a Graphology graph, a DOM container, and an optional options object. · sigmajs.org, 11 Oct 2026
- Graphology
- Sigma.js is built on Graphology, which it requires as its graph data structure. · sigmajs.org, 11 Oct 2026
- Installation
- The quickstart documents installation through a CDN or package managers including npm and Yarn. · sigmajs.org, 11 Oct 2026
- Integrations
- The quickstart documents installation through a CDN or a package manager, and the browser bundle page describes a standalone UMD bundle. · sigmajs.org, 11 Oct 2026
- Interactions
- Pan, zoom, hover, and multi-touch interactions work out of the box, according to the homepage. · sigmajs.org, 11 Oct 2026
- License
- The project is developed under the MIT License. · sigmajs.org, 11 Oct 2026
- Maker background
- Sciences Po médialab describes itself as an interdisciplinary research laboratory that brings together sociologists, engineers, and designers. · medialab.sciencespo.fr, 11 Oct 2026
- Platform
- web · sigmajs.org, 23 Sept 2026
- Publisher and license
- The site says Sigma.js is published by Sciences Po médialab and OuestWare, with support from gdotv, and developed under the MIT License. · sigmajs.org, 11 Oct 2026
- Purpose
- Sigma.js is a WebGL-powered JavaScript library for interactive graph visualization in the browser. · sigmajs.org, 11 Oct 2026
- Rendering
- The homepage says GPU-accelerated WebGL rendering supports smooth display and interaction on complex graphs. · sigmajs.org, 11 Oct 2026
- Scale
- The project describes the library as aimed at visualizing graphs of thousands of nodes and edges. · github.com, 11 Oct 2026
- Setup requirement
- The quickstart says the graph needs a container DOM element with a defined width and height. · sigmajs.org, 11 Oct 2026
- Support
- The project links to documentation, Mastodon, GitHub, and Stack Overflow as resources. · sigmajs.org, 11 Oct 2026
Where Sigma.js stands on Freedom251
- Data Visualization Software#52 of 98