Freedom251 › Data Visualization Software
psyplot
What psyplot is
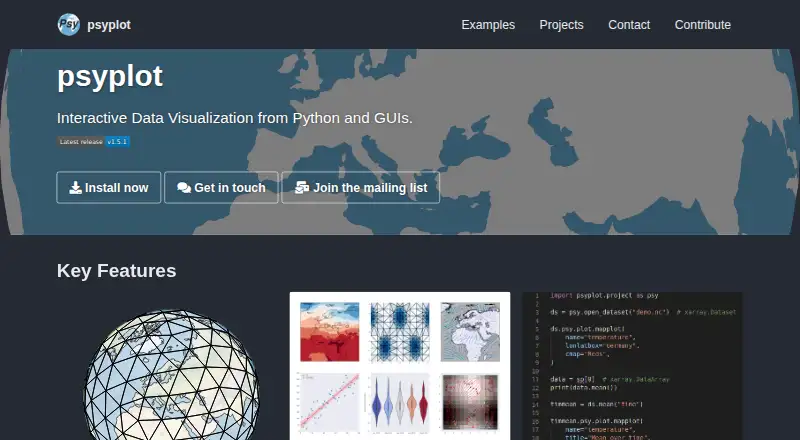
psyplot is a free, open-source interactive data visualization framework for Python and graphical interfaces. It runs as desktop software on Linux and reads netCDF, GRIB, GeoTIFF, and other formats supported by xarray. The project uses a command-line-first workflow with high-level APIs for Python scripts. Its core package manages and decodes data using CF and UGRID conventions, while two-dimensional plotting supports unstructured grids such as ICON and UGRID. The psy-simple plugin adds one- and two-dimensional plot methods. psy-maps uses Cartopy to display regular and unstructured data on maps. The psyplot GUI supports interactive analysis through an in-process terminal, help explorer, and controls for changing plots and project contents. psy-view is a standalone netCDF inspection widget that can also be embedded in the GUI. psy-reg uses statsmodels and SciPy for regression models. Installation is documented through conda, pip, or source, with conda recommended.
Who it suits
It suits Linux users working with scientific data in Python or a graphical interface, especially research teams exploring analysis questions. Users handling CF, UGRID, regular, or unstructured datasets can use its plotting and decoding tools.
What it does well
- Free open-source software
- Supports netCDF, GRIB, GeoTIFF, and xarray formats
- Handles unstructured ICON and UGRID grids
- GUI includes terminal and help explorer
- Regression plugin uses statsmodels and SciPy
What to know first
- Linux desktop platform only
- Requires several Python dependencies
- Some capabilities come through separate plugins
Plans
| Plan | Billed and limits | Price |
|---|---|---|
| psyplot | Open-source software; install via pip, conda, or source | Free |
As psyplot.github.io lists them, read 11 Oct 2026. The maker's own page has the final word.
Verdict
psyplot combines scripted and GUI workflows for scientific visualization on Linux. Its format coverage, grid handling, mapping, netCDF inspection, and regression plugins make it suitable for data-focused users who prefer Python-based tools.
Facts from psyplot's own pages
- Dashboard type
- interactive · psyplot.github.io, 24 Sept 2026
- Data conventions
- The core package provides data management and decoding for CF and UGRID conventions. · psyplot.github.io, 11 Oct 2026
- Data sources
- netCDF,GRIB,GeoTIFF and other formats supported by xarray · psyplot.github.io, 24 Sept 2026
- Dependencies
- The documentation lists xarray, matplotlib, PyYAML, docrep, and funcargparse as required dependencies. · psyplot.github.io, 11 Oct 2026
- Free plan
- Yes · psyplot.github.io, 24 Sept 2026
- Grid support
- Its 2D plot methods support unstructured grids, including ICON and UGRID conventions. · psyplot.github.io, 11 Oct 2026
- GUI
- The psyplot GUI supports interactive analysis and includes an in-process terminal, help explorer, and tools to change plots and project contents. · psyplot.github.io, 11 Oct 2026
- Installation
- The project documents installation with conda, pip, or from source, and recommends conda. · psyplot.github.io, 11 Oct 2026
- Intended users
- The project describes its framework as designed for analysis questions in pioneering research. · psyplot.github.io, 11 Oct 2026
- License
- The psy-view documentation states that its source code is licensed under LGPL-3.0-only. · psyplot.github.io, 11 Oct 2026
- Mapping
- The psy-maps plugin uses Cartopy to visualize regular and unstructured data on maps. · psyplot.github.io, 11 Oct 2026
- NetCDF viewer
- psy-view is a standalone widget for investigating netCDF file contents and can also be embedded in the psyplot GUI. · psyplot.github.io, 11 Oct 2026
- Platform
- desktop · psyplot.github.io, 24 Sept 2026
- Plot types
- The psy-simple plugin provides plot methods for visualizing 1D and 2D data. · psyplot.github.io, 11 Oct 2026
- Purpose
- psyplot is an interactive data visualization framework for Python and GUIs. · psyplot.github.io, 11 Oct 2026
- Regression
- The psy-reg plugin uses statsmodels and SciPy to fit regression models to data. · psyplot.github.io, 11 Oct 2026
- Scripting
- The project describes its standard as command-line first and provides high-level APIs for Python scripts. · psyplot.github.io, 11 Oct 2026
- Support
- The project directs users to developer chat, a mailing list, or its bug tracker for help. · psyplot.github.io, 11 Oct 2026
Where psyplot stands on Freedom251
- Data Visualization Software#57 of 98