Freedom251 › Data Visualization Software
funkyheatmap
What funkyheatmap is
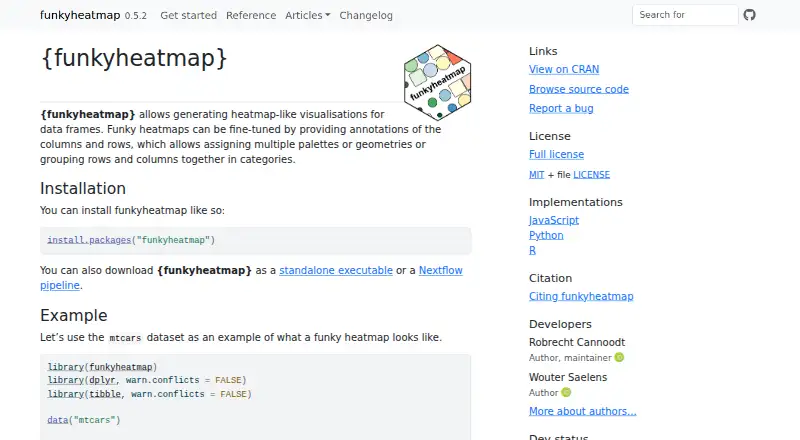
funkyheatmap is a free toolkit for creating heatmap-like visualizations from R data frames or matrices. It adds row and column annotations, supports grouping into categories, and allows multiple palettes or geometries. Documented elements include text, bars, rectangles, circles, and funky rectangles, with numerical and categorical palettes. The R package is available from CRAN and requires R version 2.10 or later; Windows binaries and macOS binaries for arm64 and x86_64 are listed. A standalone executable accepts TSV data and a YAML palette file and can generate a PDF, but its setup requires Docker and Bash. A Nextflow module offers another workflow and also requires Docker and Bash. FunkyHeatmap.js provides an interactive browser adaptation built with d3.js; websites can use d3.js, lodash, and funkyheatmapjs, or install it in an npm project with npm or yarn. The project uses the MIT license, and bugs can be reported through GitHub issues.
Who it suits
It suits R users and data teams needing customizable annotated heatmap-style plots. Developers can also use the standalone, Nextflow, or JavaScript options for other workflows.
What it does well
- Free and MIT-licensed
- Supports data frames and matrices
- Multiple plot geometries and palettes
- CRAN package with Windows and macOS binaries
- Interactive JavaScript adaptation available
What to know first
- Standalone executable requires Docker and Bash
- Nextflow setup also requires Docker and Bash
- Scheduled refresh is not available
- R package requires R 2.10 or later
Verdict
funkyheatmap offers several ways to build annotated heatmap-like graphics, from R to browser JavaScript. Choose the package, executable, workflow, or JavaScript route based on your environment and its setup requirements.
Facts from funkyheatmap's own pages
- Customization
- Annotations can assign multiple palettes or geometries and group rows or columns into categories. · funkyheatmap.github.io, 11 Oct 2026
- Dashboard type
- static · funkyheatmap.github.io, 23 Sept 2026
- Data setup
- The R function accepts a data frame and supports column information, row information, palettes, and legends for customizing a plot. · funkyheatmap.github.io, 11 Oct 2026
- Data sources
- R data frames; matrices · funkyheatmap.github.io, 23 Sept 2026
- Example use
- The documentation shows funkyheatmap recreating figures from the single-cell integration benchmarking project, scIB. · funkyheatmap.github.io, 11 Oct 2026
- Executable requirements
- The standalone executable requires Docker and Bash. · funkyheatmap.github.io, 11 Oct 2026
- Free plan
- Yes · funkyheatmap.github.io, 23 Sept 2026
- JavaScript adaptation
- FunkyHeatmap.js is an interactive browser adaptation of the R package built with d3.js. · funkyheatmap.github.io, 11 Oct 2026
- JavaScript dependencies
- The JavaScript version can be added to a website using d3.js, lodash, and funkyheatmapjs from an npm package service, or installed in an npm project with npm or yarn. · funkyheatmap.github.io, 11 Oct 2026
- License
- The package is distributed under the MIT license. · cran.r-project.org, 11 Oct 2026
- Maintainer
- Robrecht Cannoodt is listed as author and maintainer; Wouter Saelens is listed as an author. · funkyheatmap.github.io, 11 Oct 2026
- Nextflow
- A Nextflow module is available and its documented setup requires Docker and Bash. · funkyheatmap.github.io, 11 Oct 2026
- Output
- The executable example generates a plot as a PDF file. · funkyheatmap.github.io, 11 Oct 2026
- Plot elements
- The documentation demonstrates text, bars, rectangles, circles, and funky rectangles as plot geometries. · funkyheatmap.github.io, 11 Oct 2026
- Purpose
- funkyheatmap generates heatmap-like visualizations for data frames, with annotations for rows and columns. · funkyheatmap.github.io, 11 Oct 2026
- R package
- The package is available to install from CRAN and depends on R version 2.10 or later. · cran.r-project.org, 11 Oct 2026
- Scheduled refresh
- No · funkyheatmap.github.io, 23 Sept 2026
- Standalone executable
- A standalone executable accepts TSV data and a YAML file for palettes; its setup requires Docker and Bash. · funkyheatmap.github.io, 11 Oct 2026
- Support
- The project page links to GitHub for bug reports. · funkyheatmap.github.io, 11 Oct 2026
- Visual options
- The getting started guide demonstrates text, bar, rectangle, funky rectangle, and circle geometries, alongside numerical and categorical palettes. · funkyheatmap.github.io, 11 Oct 2026
- Windows and macOS downloads
- CRAN lists Windows binaries and macOS binaries for arm64 and x86_64. · cran.r-project.org, 11 Oct 2026
- Workflow option
- A Nextflow pipeline is available and requires Docker and Bash. · funkyheatmap.github.io, 11 Oct 2026
Where funkyheatmap stands on Freedom251
- Data Visualization Software#58 of 98