Freedom251 › Nonprofit Impact Measurement Software

UpMetrics
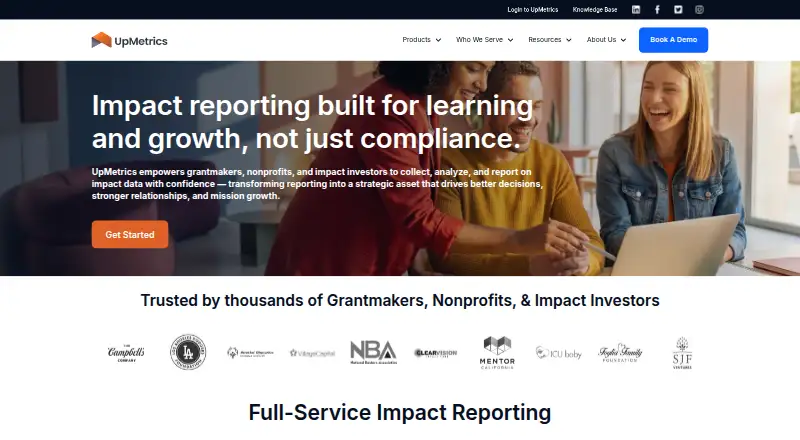
What UpMetrics is
UpMetrics is an impact reporting platform for nonprofits, grantmakers, foundations, and impact investors. It covers the reporting process from selecting measures to sharing results, bringing together customizable metrics, collaborative data collection, centralized data management, analytics, and external storytelling. Teams can code and categorize stories, photos, interviews, and testimonials, associate them with programs, and analyze them alongside quantitative data. Charts and dashboards can be shared by public link, embedded, or exported without exposing underlying data. Integrations include Google Sheets, SurveyMonkey, Qualtrics, CSV exports, and some grant-management systems; custom API and RPA integrations are available through Services. UpMetrics is SOC 2 Type 2 compliant. It says hosted content is encrypted at rest and in transit, customer data is logically separated, and sensitive access uses MFA. A funder may offer a free basic license to a nonprofit that only needs to complete incoming reports, with limited features. Standard onboarding usually takes about four to six weeks, depending on complexity and scope. The platform is available as a web service and extension.
Who it suits
UpMetrics is intended for nonprofits, grantmakers, foundations, and impact investors managing impact measurement and reporting. Nonprofits completing incoming reports may be able to access a limited-feature basic license through a funder.
What it does well
- Combines qualitative and quantitative analysis.
- Dashboards can be shared without exposing underlying data.
- Supports several survey and spreadsheet integrations.
- Free plan and free trial are listed.
What to know first
- Free basic nonprofit access has limited features.
- Standard onboarding usually takes four to six weeks.
- Paid plans start at $1,450 a year.
Limits
The free Starter Plan lists an impact framework builder, themed framework templates, and a public profile page. Paid plans list capacity limits: Professional has 10 users, 10 tables, and 1 interactive dashboard; Premium has 15 users, 20 tables, and 5 dashboards; Enterprise has 20 users, 40 tables, and 40 dashboards; Elite has 100 users, 200 tables, and 200 dashboards.
Plans
| Plan | Billed and limits | Price |
|---|---|---|
| Starter Plan | free, unlimited access · Impact framework builder · themed framework templates · public profile page | Free |
| Professional | $1450 /yearly · $149 /monthly · 10 users · 10 tables · 1 interactive dashboard | $1,450 |
| Premium | $2400 /yearly · $249 /monthly · 15 users · 20 tables · 5 interactive dashboards | $2,400 |
| Enterprise | $4300 /yearly · $449 /monthly · 20 users · 40 tables · 40 interactive dashboards | $4,300 |
| Elite | $6250 /yearly · $650 /monthly · 100 users · 200 tables · 200 interactive dashboards | $6,250 |
| Impact Funder Plans | Pricing is discussed directly with the UpMetrics team · Customized to organization size, goals, and complexity | On request |
As upmetrics.com lists them, read 30 Sept 2026. The maker's own page has the final word.
Getting started
- Visit https://upmetrics.com/.
- Choose the free Starter Plan or review the Professional, Premium, Enterprise, and Elite tiers.
- For an Impact Funder Plan, discuss pricing directly with the UpMetrics team.
- Arrange onboarding; standard implementation usually takes about four to six weeks.
- Connect supported data sources or discuss custom API and RPA integrations through Services.
UpMetrics is an impact-reporting platform for nonprofits, grantmakers, and impact investors. It fits organizations that need one place for measurement, data collection, analysis, and public-facing reporting, especially when qualitative evidence matters alongside metrics. The trade-off is a four-to-six-week typical onboarding period and a free tier that covers only a narrow use case.
Overview
UpMetrics follows the impact-reporting lifecycle from deciding what to measure through distributing results. Teams can define custom indicators and outcome frameworks, collect mixed data collaboratively, manage it centrally, analyze it, and turn findings into external stories. That end-to-end structure is useful when program learning and formal reporting must stay connected instead of being rebuilt in separate spreadsheets and presentation tools.
Its strongest distinction is qualitative analysis. Stories, photographs, interviews, and testimonials can be coded, categorized, linked to programs, and examined with quantitative results. Organizations whose impact claims depend on context and participant voice will get more from this approach than teams that need only numeric scorecards.
Key features
Custom frameworks support organization-specific measures rather than forcing every program into a fixed template. Data can arrive through Google Sheets, SurveyMonkey, Qualtrics, CSV exports, and some grant-management systems. Custom API and RPA connections are offered through Services, which gives organizations with more complicated infrastructure a route to integration but may add implementation scope.
Charts and dashboards can be reused, shared by public link, embedded, or exported without revealing the underlying data. That separation is practical for publishing outcomes while keeping source records restricted. UpMetrics is SOC 2 Type 2 compliant; its policies follow applicable ISO 27001 and SOC 2 Trust Service criteria. AWS-hosted content is encrypted in transit and at rest, customers are logically separated, and sensitive access can use multi-factor authentication. The company says it will notify customers in writing within 72 hours of a confirmed breach.
Implementation usually takes about four to six weeks, depending on data complexity, programs, grantees, and service scope. The UpMetrics Community adds client networking, resources, on-demand training, and direct engagement with staff, which is valuable for teams building a reporting practice rather than simply activating a software account.
Pricing
UpMetrics uses a freemium model, with free access and a free trial. The Starter Plan costs free, billed free with unlimited access, and includes an impact framework builder, themed framework templates, and a public profile page. It is suitable for establishing a basic framework or presenting a profile, but it does not match the broader collection, analysis, and dashboard needs of a full reporting operation.
Professional costs $1,450 a year when billed annually or $149 /monthly, with 10 users, 10 tables, and one interactive dashboard. It is the entry point for a small team, though the table and dashboard ceilings can constrain organizations managing several programs. Premium is $2,400 a year or $249 /monthly; it raises capacity to 15 users, 20 tables, and five interactive dashboards, making it a better fit for a growing portfolio.
Enterprise costs $4,300 a year or $449 /monthly, allowing 20 users, 40 tables, and 40 interactive dashboards. That dashboard allowance suits organizations publishing many program views. Elite costs $6,250 a year or $650 /monthly, with 100 users, 200 tables, and 200 interactive dashboards for large, multi-program teams. Impact Funder Plans use custom pricing discussed directly with UpMetrics and are tailored to organization size, goals, and complexity. A funder can also issue a free basic license to a nonprofit that only needs to complete incoming reports; that license has a limited feature set, so it is not a substitute for the paid platform.
Platforms
UpMetrics is offered as a web platform and an extension. Its integrations and export options make it workable alongside common survey and spreadsheet workflows.
Who it's for
Nonprofits, foundations and other grantmakers, and impact investors are the core audience. It is especially appropriate for funders coordinating reporting across grantees and for organizations that need to combine outcome measures with coded narrative evidence. Funder-sponsored cohorts can provide nonprofits with access, training, and peer learning. A small nonprofit that only submits a funder’s form, or a team wanting a lightweight mobile data-collection app, may find the broader workflow and onboarding unnecessary.
Pros and cons
Pros
- Quantitative and qualitative evidence in one workflow: coded stories and interviews can be analyzed beside program metrics.
- Flexible measurement: custom indicators and outcome frameworks accommodate organization-specific goals.
- Controlled publishing: reusable dashboards, embeds, public links, and exports support external reporting without exposing source data.
- Enterprise-minded protection: SOC 2 Type 2 compliance, encryption, logical customer separation, MFA, and a 72-hour breach-notification commitment address governance needs.
- Funder support model: community resources and sponsored cohorts can reduce the burden of building reporting capability alone.
Cons
- Onboarding takes time: the usual four-to-six-week setup is a meaningful project for organizations that need immediate reporting.
- Free access is narrow: Starter focuses on framework building and a public profile, while funder-issued basic licenses are limited to incoming reports.
- Capacity rises by paid tier: user, table, and dashboard limits mean growing teams must move up plans.
- Advanced integrations are service-led: custom API and RPA connections require Services rather than being part of the core self-serve offer.
Alternatives
For a wider shortlist, see Nonprofit Impact Measurement Software.
- SIA MIS is a paid product with a free plan and trial, available on Android, iOS, and web; choose it when mobile coverage is more important.
- CommCare offers a free edition, Android, API, self-hosted, and web options, and is open source; choose it when open licensing or self-hosting is central.
- CharityIQ has a free UK grant-matching plan and paid tiers; choose it when grant discovery is the primary task.
- Clear Impact provides a free scorecard and participant-record limits plus paid Showcase plans; choose it for a more bounded scorecard workflow.
- FRUIT Impact offers free and low-cost target and brand tiers; choose it when a smaller, simpler footprint fits.
- Impact Genome Registry supports free self-reporting and paid nonprofit membership; choose it when registry participation and verification are the priority.
- Heligon M&E is a paid Android, iOS, and web option with NGO project and beneficiary tiers; choose it when mobile field work is the deciding factor.
- Polyeda is a paid API and web product with a free trial; choose it when an API-first deployment is preferred.
Verdict
Choose UpMetrics if your nonprofit, funder, or impact-investing team needs a governed reporting system that combines custom metrics with analyzable stories and polished external sharing. Its main reason to look elsewhere is the implementation commitment and escalating paid limits: teams with a narrow submission task, a mobile-first need, or a simple scorecard will likely be better served by a more focused alternative.
Verdict
UpMetrics brings measurement, data collection, analysis, and reporting into one impact reporting workflow. Organizations should account for its onboarding period and confirm which plan or funder-sponsored access fits their needs.
Questions
Is UpMetrics free?
Yes. The Starter Plan costs nothing and is listed with unlimited access. A funder can also issue a nonprofit a free basic license for completing incoming reports, with limited features.
How much do the paid plans cost?
Professional is $1,450 a year, Premium is $2,400 a year, Enterprise is $4,300 a year, and Elite is $6,250 a year. Their listed monthly billing amounts are $149, $249, $449, and $650 respectively.
What platforms does UpMetrics support?
UpMetrics is available on the web and as an extension.
What integrations does it support?
It supports Google Sheets, SurveyMonkey, Qualtrics, CSV exports, and some grant-management systems. Custom API and RPA integrations are available through Services.
Can teams analyze qualitative information?
Yes. Stories, photos, interviews, and testimonials can be coded, categorized, associated with programs, and analyzed alongside quantitative data.
How long does implementation take?
Standard onboarding usually takes about four to six weeks, depending on data complexity, programs, grantees, and service scope.
Facts from UpMetrics's own pages
- Audience
- UpMetrics is built for nonprofits, grantmakers, and impact investors, with funder-sponsored cohorts that provide nonprofits access, training, and peer learning. · upmetrics.com, 30 Sept 2026
- Core workflow
- The platform connects customizable metrics, collaborative data collection and reporting, centralized data management, analytics, and external storytelling. · upmetrics.com, 30 Sept 2026
- Data protection
- AWS-hosted content is encrypted at rest and in transit, with logical separation between customers and MFA for sensitive access. · upmetrics.com, 30 Sept 2026
- Founded
- 2019 · upmetrics.com, 28 Sept 2026
- Free access limitation
- A funder can issue a free basic license to a nonprofit that only needs to complete incoming reports, with a limited feature set. · upmetrics.com, 30 Sept 2026
- Implementation
- Standard onboarding usually takes about four to six weeks, depending on data complexity, programs, grantees, and service scope. · upmetrics.com, 30 Sept 2026
- Incident notification
- UpMetrics says it will notify customers in writing within 72 hours of a confirmed security breach. · upmetrics.com, 30 Sept 2026
- Integrations
- UpMetrics supports Google Sheets, SurveyMonkey, Qualtrics, CSV exports, and some grant-management systems; custom API and RPA integrations are available through Services. · upmetrics.com, 30 Sept 2026
- Purpose
- UpMetrics manages the complete impact reporting lifecycle, from defining what to measure through sharing results, for impact investors, foundations, and nonprofits. · upmetrics.com, 30 Sept 2026
- Qualitative analysis
- Stories, photos, interviews, and testimonials can be coded, categorized, associated with programs, and analyzed alongside quantitative data. · upmetrics.com, 30 Sept 2026
- Security
- UpMetrics is SOC 2 Type 2 compliant, and its security policies follow applicable ISO 27001 and SOC 2 Trust Service principles and criteria. · upmetrics.com, 30 Sept 2026
- Sharing
- Charts and dashboards can be reused, shared through public links, embedded, or exported without exposing underlying data. · upmetrics.com, 30 Sept 2026
- Support
- The UpMetrics Community provides client networking, resources, on-demand training, and direct engagement with UpMetrics staff. · help.upmetrics.com, 30 Sept 2026