Freedom251 › Hardware Monitoring Software
Prometheus Node Exporter
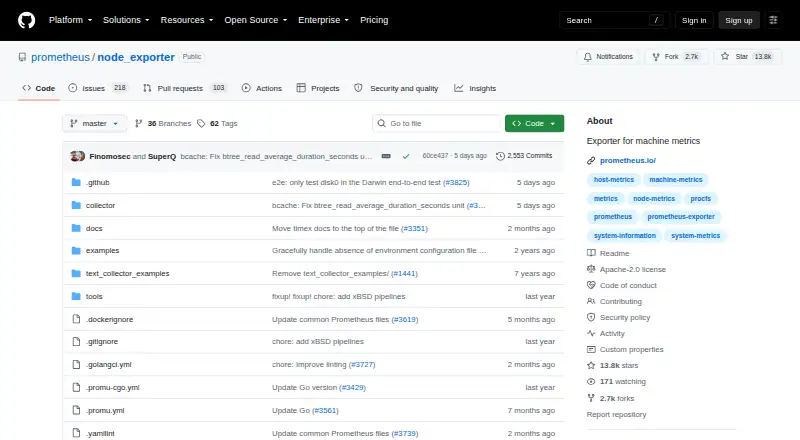
What Prometheus Node Exporter is
Prometheus Node Exporter exposes hardware and operating system metrics from *NIX kernels for Prometheus. Written in Go, it uses pluggable collectors; default collectors cover CPU, disk I/O, filesystem, memory, and network metrics, though availability varies by operating system. Collectors can be turned on or off with command-line flags, and some support include or exclude filters. The exporter listens on HTTP port 9100 by default. The project documents installation through Linux distribution packages, an Ansible community role, and container deployment. Containerized host monitoring needs host namespace access and suitable mounts; some systems also need an extra capability for the timex collector. Certain collectors are disabled by default because they can involve high-cardinality data, longer runtimes, or added host resource demands. The project recommends Windows Exporter for Windows users. The download page lists binaries for Darwin amd64, Darwin arm64, and Linux amd64. Node Exporter is available under the Apache 2 License, with no paid plans listed, and Prometheus documentation lists it as a guide for monitoring Linux host metrics.
Who it suits
Node Exporter suits users monitoring hardware and operating system metrics from *NIX kernels for Prometheus. It may fit teams comfortable configuring collectors and, for container deployment, providing the required host access and mounts.
What it does well
- Default collectors cover CPU, disk, filesystem, memory, and network.
- Collectors can be enabled or disabled with command-line flags.
- Documentation covers packages, Ansible, and container deployment.
- Free software under the Apache 2 License.
What to know first
- Metric availability varies by operating system.
- Containerized host monitoring requires host namespace access and mounts.
- Some systems need an extra capability for the timex collector.
- The project recommends Windows Exporter for Windows users.
Plans
| Plan | Billed and limits | Price |
|---|---|---|
| Free | Apache 2.0 licensed software · no paid plans listed | Free |
As github.com lists them, read 9 Oct 2026. The maker's own page has the final word.
Getting started
- Open the project at https://github.com/prometheus/node_exporter.
- Choose a documented installation route: Linux distribution package, Ansible community role, or container deployment.
- For containerized host monitoring, provide host namespace access and suitable mounts.
- Configure collectors with command-line flags and any supported include or exclude filters.
- Connect Prometheus to the exporter at its default HTTP port, 9100.
Prometheus Node Exporter is a host-metrics component for Prometheus, best suited to operators managing Unix-like systems who want control over what each host reports. Its focused scope and open-source price are compelling; deployment and monitoring remain the operator’s responsibility.
Overview
Node Exporter publishes hardware and operating-system measurements for Prometheus to scrape. It is a building block for infrastructure monitoring, not a full monitoring service. Default collectors cover CPU, disk I/O, filesystems, memory, and networking, though coverage varies by operating system.
Written in Go, it uses pluggable collectors and listens on HTTP port 9100 by default. That makes it a natural fit for an existing Prometheus setup, but teams must handle endpoint access and deployment configuration themselves.
Key features
- Host metrics: Core resource measurements help operators track machine health and utilization. Platform differences mean the same metrics should not be expected on every system.
- Collector controls: Command-line flags let operators enable or disable collectors; some also support include and exclude filters. This flexibility helps tailor collection, but requires decisions about what each host should expose.
- Optional collectors: Some are off by default because they can add cardinality, take longer to run, or demand more host resources. Enabling them may provide more coverage at an operational cost.
- Deployment choices: Documentation covers Linux distribution packages, an Ansible community role, and containers. Container monitoring needs host namespace access and suitable mounts; some systems also require an extra capability for the timex collector.
- Prometheus fit: Prometheus documentation includes Node Exporter as a guide for Linux host monitoring. Vulnerability reports are directed to the Prometheus security policy.
Pricing
Node Exporter is free open-source software under the Apache 2 License. The Free plan costs nothing and includes the software without a paid tier. There is no free trial because the software is already free to use; there are no paid-plan renewals or seat charges to weigh.
The zero price does not remove the work of deploying and operating an exporter or integrating it with Prometheus. It is a strong fit for teams that can manage that infrastructure, rather than buyers seeking a packaged monitoring service.
Platforms
Supported platforms include Linux, macOS, and self-hosted environments. The download page lists binaries for Darwin amd64, Darwin arm64, and Linux amd64. Although Windows appears among the broader platform tags, the project recommends Windows Exporter for Windows users, making Node Exporter the wrong default choice for Windows host metrics.
The product is tagged for API use, but its documented role is to expose host metrics over HTTP; it is not described as an application API service. Remote monitoring, synthetic monitoring, and DNS monitoring are marked as supported, while real-user monitoring is not. Those classifications do not change its core purpose as a host exporter for Prometheus.
Who it's for
Node Exporter suits infrastructure teams and administrators already using Prometheus who need host-level CPU, disk, filesystem, memory, or network data and want to choose collectors per machine. Package, Ansible, and container deployment options accommodate different operating practices, provided teams can meet the container access requirements where relevant.
It is a poor fit for Windows-first monitoring, or for readers who want a ready-made uptime or user-experience monitoring service rather than a component to integrate and maintain.
Pros and cons
- Pro: Free, Apache 2-licensed software avoids per-host software charges and fits teams building around Prometheus.
- Pro: Pluggable collectors and command-line controls let operators tune collection, including filters for some collectors.
- Pro: Documented package, Ansible, and container deployments give teams several installation paths.
- Con: Metric coverage varies by operating system, limiting consistency across mixed fleets.
- Con: Container deployment requires host namespaces and mounts, with an additional capability needed on some systems for the timex collector.
- Con: Windows users are directed to a separate exporter, so this is not the straightforward choice for Windows hosts.
Alternatives
For broader internet and service monitoring, these alternatives offer different monitoring scopes and deployment models:
- Internet Performance Monitoring Software and Hardware Monitoring Software provide category starting points for comparing tools.
- Site24x7 Website Monitoring is worth considering for website monitoring with a free tier capped at 50 resources and instant downtime email alerts, or a paid Web Uptime plan at $9 a month.
- Dotcom-Monitor may suit teams seeking target-based monitoring: its free plan covers up to 25 targets, checks as often as every five minutes, and two monitoring locations.
- HetrixTools is an alternative for users who want uptime and server monitors in one free tier, with 15 of each and one-minute checks.
- Better Stack is an option for personal projects needing a broader set of monitoring and incident tools, with 10 monitors and heartbeats, a status page, and limited logs, traces, exceptions, and session replays on its free plan.
- Uptime Kuma is another free, self-hosted option for users looking for an uptime-monitoring tool rather than a Prometheus host exporter.
- UptimeRobot may fit hobby or nonprofit projects wanting hosted checks; its free plan includes 50 monitors at five-minute intervals.
- Checkly is an alternative for teams that need browser and API checks, with a free Hobby plan covering 10 uptime monitors and capped browser and API runs.
- SmokePing is a free, self-hosted alternative for users who can meet its Unix, Perl, RRDtool, FPing, and web-server requirements.
Verdict
Choose Node Exporter if you run Prometheus and want a free, configurable source of Unix-like host metrics. Its main advantage is a focused collector model with several documented deployment paths; look elsewhere for Windows host collection or a complete hosted monitoring service.
Verdict
Node Exporter provides configurable host metrics for Prometheus, with documented package, Ansible, and container deployment options. Check the operating-system coverage and container access requirements for your environment.
Questions
How much does Node Exporter cost?
The Free plan is listed as free. It is Apache 2 licensed software, and no paid plans are listed.
Which operating systems does it support?
The listed platforms include Linux, macOS, and self-hosted environments. Windows users are directed to Windows Exporter; metric availability varies by operating system.
What metrics does it collect?
Default collectors include CPU, disk I/O, filesystem, memory, and network metrics. Collectors can be enabled or disabled with command-line flags.
How is it installed?
The project documents Linux distribution packages, an Ansible community role, and container deployment.
What license does it use?
Prometheus components are available under the Apache 2 License.
What port does it use by default?
Node Exporter listens on HTTP port 9100 by default.
Facts from Prometheus Node Exporter's own pages
- Collectors
- It is written in Go and uses pluggable metric collectors. · github.com, 9 Oct 2026
- Configuration
- Collectors can be enabled or disabled with command-line flags, and some support include or exclude filters. · github.com, 9 Oct 2026
- Container deployment
- Containerized host monitoring requires host namespace access and appropriate mounts; the documentation also notes that some systems need an extra capability for the timex collector. · github.com, 9 Oct 2026
- Endpoint
- Node Exporter listens on HTTP port 9100 by default. · github.com, 9 Oct 2026
- Installation
- The project documents Linux distribution packages, an Ansible community role, and container deployment. · github.com, 9 Oct 2026
- Integrations
- The Prometheus documentation lists Node Exporter as a guide for monitoring Linux host metrics. · prometheus.io, 9 Oct 2026
- License
- Prometheus components are available under the Apache 2 License. · prometheus.io, 9 Oct 2026
- Metrics
- Default collectors include CPU, disk I/O, filesystem, memory, and network metrics, with support varying by operating system. · github.com, 9 Oct 2026
- Optional collectors
- Some collectors are disabled by default due to factors such as high cardinality, long runtime, or host resource demands. · github.com, 9 Oct 2026
- Purpose
- Node Exporter exposes hardware and operating system metrics from *NIX kernels for Prometheus. · github.com, 9 Oct 2026
- Release platforms
- The download page lists Node Exporter binaries for Darwin amd64, Darwin arm64, and Linux amd64. · prometheus.io, 9 Oct 2026
- Security reporting
- The repository directs vulnerability reports to the Prometheus security policy. · github.com, 9 Oct 2026
- Windows support
- The project recommends Windows Exporter for Windows users. · github.com, 9 Oct 2026
Where Prometheus Node Exporter stands on Freedom251
- Hardware Monitoring Software#30 of 59
- Hardware monitoring tools#38 of 59