Freedom251 › Anomaly Detection Software

ObservabilityOS
What ObservabilityOS is
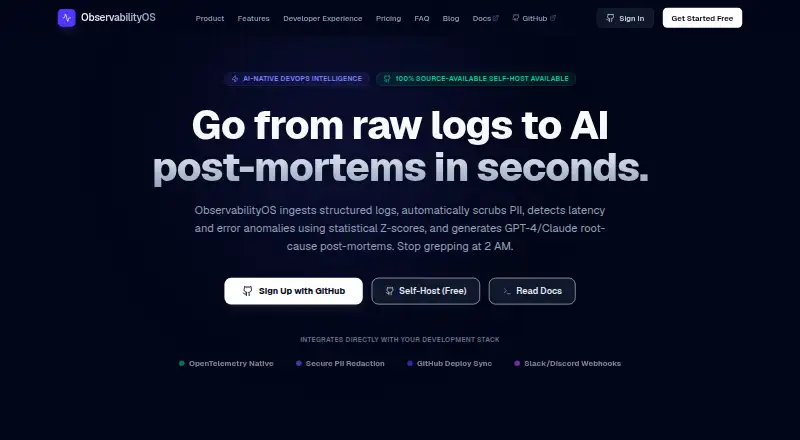
ObservabilityOS is an observability platform that ingests structured logs, scrubs sensitive data, detects anomalies, and creates AI-assisted incident post-mortems. Its rolling statistical Z-score baselines look for unusual error rates, latency, and CPU usage. Incident analysis uses GPT-4 or Claude to describe what happened and why, and suggest a hotfix. Logs can come through a JavaScript/TypeScript SDK or a Docker sidecar that collects local logs and container output. The platform also supports native OTLP HTTP/JSON ingestion and lists integrations including OpenTelemetry, GitHub, Slack, Discord, Microsoft Teams, Docker, Kubernetes, PostgreSQL, and Redis. Incident tools include threaded comments, runbooks, service health dashboards, SLOs, and live SSE monitoring. The site says telemetry is scrubbed before database storage and sensitive client data is not sent to external LLMs. A free source-available self-hosted plan uses Docker/Compose. The Free Developer plan includes one service, 500MB of logs per month, and seven-day retention. Pro Cloud is $29/mo, with 10 services, 10GB monthly logs, and 30-day retention.
Who it suits
It suits teams that need log and metric anomaly detection alongside incident workflows. A self-hosted option is available for teams deploying with Docker/Compose.
What it does well
- Native OTLP HTTP/JSON ingestion
- Scrubs sensitive telemetry before storage
- Includes runbooks and service health dashboards
- Free self-hosted plan has unlimited services and logs
What to know first
- Free Developer limits usage to one service
- Free Developer retains logs for seven days
- Pro Cloud costs $29/mo
Limits
Free Developer includes one service, 500MB of logs per month, and seven-day retention. Self-Host Source-Available lists unlimited services, logs, and retention, with bring-your-own keys for multi-channel alerts and AI analysis. Pro Cloud lists 10 services, 10GB of logs per month, and 30-day retention.
Plans
| Plan | Billed and limits | Price |
|---|---|---|
| Free Developer | Free / Source-Available · 1 service · 500MB logs / month · 7-day retention | Free |
| Self-Host Source-Available | Free / Source-Available · Unlimited services · Unlimited logs · Unlimited retention · Bring your own keys for multi-channel alerts and AI analysis | Free |
| Pro Cloud | $29 / month≈ ₹2,499 / month in India · 10 services · 10GB logs / month · 30-day retention | $29 a month |
As observabilityos.in lists them, read 29 Sept 2026. The maker's own page has the final word.
Getting started
- Visit https://www.observabilityos.in/.
- Choose Free Developer, Self-Host Source-Available, or Pro Cloud.
- For self-hosting, use the listed Docker/Compose deployment option.
- Collect logs with the JavaScript/TypeScript SDK or Docker sidecar, or use native OTLP HTTP/JSON ingestion.
- Connect listed integrations such as OpenTelemetry, GitHub, Slack, Docker, or Kubernetes.
Verdict
ObservabilityOS combines telemetry collection, anomaly detection, and incident follow-up in one platform. Its free plans have different usage limits, so check which plan fits your service and retention needs.
Questions
Is there a free plan?
Yes. Free Developer is free, and a separate free source-available self-hosted plan is also listed.
What are the Free Developer limits?
The plan includes one service, 500MB of logs per month, and seven-day retention.
How much does Pro Cloud cost?
Pro Cloud is listed at $29 / month (≈ ₹2,499 / month in India). It includes 10 services, 10GB of logs per month, and 30-day retention.
Can I self-host ObservabilityOS?
Yes. The free source-available self-hosted plan offers Docker/Compose deployment and GitHub community support.
Which integrations are listed?
Integrations include OpenTelemetry, GitHub, Slack, Discord, Microsoft Teams, Docker, Kubernetes, PostgreSQL, and Redis.
Which data does ObservabilityOS use for AI analysis?
The site says sensitive client data is not sent to external LLMs. It says analysis uses sanitized schema metadata, anonymized error types, and deployment context.
Facts from ObservabilityOS's own pages
- AI analysis
- The site says incident analysis uses GPT-4 or Claude to produce a post-mortem with what happened, why, and a recommended hotfix. · observabilityos.in, 29 Sept 2026
- Anomaly detection
- It uses rolling statistical Z-score baselines to detect anomalies in error rates, latency, and CPU usage. · observabilityos.in, 29 Sept 2026
- Incident tools
- Features include incident creation, threaded comments, runbooks, service health dashboards, SLOs, and live SSE monitoring. · observabilityos.in, 29 Sept 2026
- Integrations
- The site lists OpenTelemetry, GitHub, Slack, Discord, Microsoft Teams, Docker, Kubernetes, PostgreSQL, and Redis integrations. · observabilityos.in, 29 Sept 2026
- LLM data handling
- The site says sensitive client data is not sent to external LLMs; sanitized schema metadata, anonymized error types, and deployment context are processed. · observabilityos.in, 29 Sept 2026
- Log ingestion
- The product offers a zero-dependency JavaScript/TypeScript SDK and a Docker sidecar that can collect local logs or container stdout. · observabilityos.in, 29 Sept 2026
- OpenTelemetry support
- The ingestion API supports native OTLP HTTP/JSON, which the site says can be configured without code modifications for existing collectors. · observabilityos.in, 29 Sept 2026
- Privacy
- The site says telemetry is scrubbed before database storage, including credentials, authorization headers, JWTs, credit card numbers, and user-defined patterns. · observabilityos.in, 29 Sept 2026
- Self-hosting
- The pricing section offers a free source-available self-hosted plan with Docker/Compose deployment and GitHub community support. · observabilityos.in, 29 Sept 2026
- Support
- The site lists GitHub community support for the self-hosted plan and gives [email protected] as its support contact. · observabilityos.in, 29 Sept 2026
- Usage limits
- The Free Developer plan includes 1 service, 500MB of logs per month, and 7-day retention; Pro Cloud lists 10 services, 10GB per month, and 30-day retention. · observabilityos.in, 29 Sept 2026
- What it does
- ObservabilityOS ingests structured logs, scrubs PII, detects latency and error anomalies, and generates AI root-cause post-mortems. · observabilityos.in, 29 Sept 2026
Where ObservabilityOS stands on Freedom251
- Anomaly Detection Software#4 of 22