Freedom251 › Data Storytelling Tools
Graphtelling
What Graphtelling is
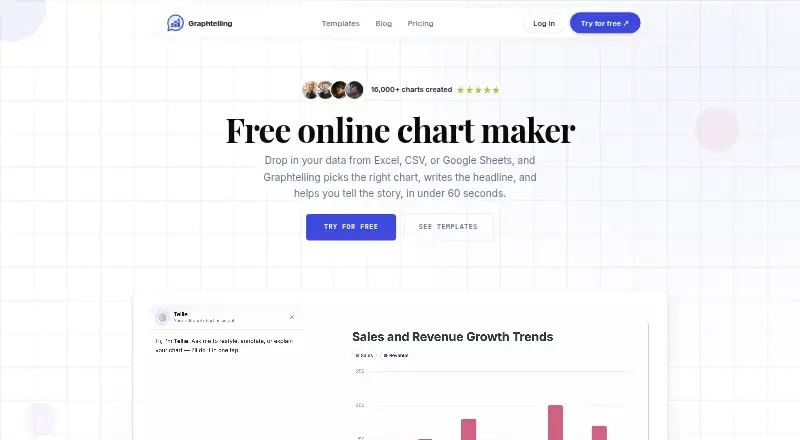
Graphtelling turns spreadsheet data and chart screenshots into editable charts, then uses AI to suggest headlines, insights, and takeaways. You can import CSV or Excel files, paste spreadsheet data, connect Google Sheets, or upload chart screenshots. All plans include 14 chart types and tables. Dashboards combine linked charts with text, arrows, shapes, images, and animations, and can be shared by link, image, or embed. Live embeds let you publish charts on websites, newsletters, or content management systems. The Free plan costs nothing and allows three charts, 50 one-time AI actions, and JPEG export with Graphtelling branding; it can view shared dashboards but not create them. Pro costs €10 a month billed yearly at €120, or €15/mo monthly. Business costs €20 a month billed yearly at €240, or €30/mo monthly. New workspaces get seven days of Pro without a credit card, capped at five charts and 30 screenshot imports. The maker says data is never shared and can be deleted at any time.
Who it suits
Graphtelling suits people who need to turn spreadsheet data or existing charts into editable visuals and shareable dashboards. Pro is described for creators, marketers, and founders; Business adds team access for up to five editors.
What it does well
- Imports spreadsheets, Google Sheets, and chart screenshots.
- All plans include 14 chart types and tables.
- Dashboards support links, images, and embeds.
- Pro and Business include unmetered AI features.
- Seven-day Pro trial requires no credit card.
What to know first
- Free plan limits users to three charts.
- Free plan cannot build dashboards.
- Free exports are JPEG only.
- Trial is capped at five charts and 30 screenshot imports.
Limits
The Free plan allows three charts, 50 one-time AI actions, JPEG export, and viewing but not building dashboards. The Pro trial lasts seven days and is capped at five charts and 30 screenshot imports. Pro allows 400 screenshot imports monthly; Business allows 800 per editor monthly, after which screenshot imports pause without overage billing.
Plans
| Plan | Billed and limits | Price |
|---|---|---|
| Free | 3 charts total · 50 AI actions one-time · JPEG export only · Graphtelling branding | Free |
| Pro | €120 billed yearly; monthly option €15/mo · Unlimited charts · 400 screenshot imports/month · 1 editor · Google Sheets import · PNG, WebP, JPEG and SVG export | €10 a month |
| Business | €240 billed yearly; monthly option €30/mo · 800 screenshot imports/editor/month · Up to 5 editors · Shared Brand Kit · Password-protected dashboards and links · Dedicated support | €20 a month |
As graphtelling.com lists them, read 7 Oct 2026. The maker's own page has the final word.
Getting started
- Open graphtelling.com in a web browser.
- Create a workspace to start the seven-day Pro trial without a credit card.
- Import CSV, Excel, pasted spreadsheet data, Google Sheets, or a chart screenshot.
- Create charts using one of the 14 chart types or tables.
- Choose a plan based on chart, editor, export, and screenshot-import needs.
- Share dashboards by link or image, or publish charts with a live embed.
Graphtelling is a web-based chart and data-storytelling workspace for turning spreadsheets or chart images into polished, editable visuals. It is particularly well suited to creators, marketers, founders, and small teams that need explanatory graphics rather than bare charts. The best reason to choose it is the connected import, narrative, and publishing workflow; the main caution is how quickly the Free tier runs out for regular production.
Overview
You can start with CSV or Excel files, pasted spreadsheet cells, Google Sheets, or a screenshot of an existing chart. Screenshot import is especially useful when the original data or design file is unavailable, because Graphtelling converts the image into an editable chart. The service also supports live embeds for websites, newsletters, and CMSs, alongside sharing by link or image.
Its dashboard concept is broader than a chart gallery. Linked charts can be arranged with text, arrows, shapes, images, and animations, creating a guided explanation or presentation flow. Security assurances are straightforward: the maker says data is stored securely, never shared, and can be deleted at any time.
Key features
Charts and AI narration
All plans include 14 chart types and tables, so the free product covers a useful range of standard reporting formats. AI can uncover insights, improve headlines, and generate takeaways, helping turn a visualization into an argument or summary. Free users receive 50 AI actions only once, which is enough to understand the workflow but not to support a continuing editorial process. On paid plans, those AI features are unmetered.
Dashboards and publishing
Dashboards combine linked visualizations with narrative annotations and presentation elements, then can be shared by link, image, or embed. That makes Graphtelling a stronger fit for explainers and recurring reports than a tool focused solely on exporting static images. The Free plan allows viewing shared dashboards but does not allow dashboard creation, so the product's most distinctive presentation feature begins with a paid subscription.
Branding and limits
Pro and Business include a Brand Kit for logos, palettes, fonts, and saved style presets. Screenshot imports are metered: Pro includes 400 per month, while Business includes 800 per editor per month. Reaching either allowance pauses screenshot importing without overage charges, a predictable constraint for teams processing many source images.
Pricing
Free — €0.00. This tier permits three charts in total, 50 one-time AI actions, JPEG export, and shared-dashboard viewing. Exports carry Graphtelling branding, and dashboard building is unavailable. Best for a brief trial or occasional basic chart, not an ongoing publishing workflow.
Pro — €10.00 per month billed yearly (€120 yearly), or €15 per month monthly. Pro removes the chart cap, adds 400 screenshot imports monthly, one editor, Google Sheets import, and PNG, WebP, JPEG, and SVG export. It suits individual creators, marketers, and founders who need regular production and unmetered AI. The single-editor setup does not cover a collaborative team.
Business — €20.00 per month billed yearly (€240 yearly), or €30 per month monthly. Business raises screenshot capacity to 800 per editor each month, supports up to five editors, adds a shared Brand Kit, password-protected dashboards and links, and dedicated support. It is the practical choice for a small group publishing branded or restricted dashboards, but costs more for users who only need solo chart exports.
New workspaces receive seven days of Pro without a credit card. The trial is capped at five charts and 30 screenshot imports, so it demonstrates the paid workflow without representing unlimited production. Free support is best-effort email; Pro targets a 48-hour response and Business a 24-hour response plus dedicated support.
Platforms
Graphtelling runs on the web. Its share mode supports both direct links and visual outputs, including live embeds and image sharing.
Who it's for
Choose Graphtelling when you need to move from mixed data sources to an editable chart, an AI-assisted explanation, and a shareable dashboard in one place. Pro is aimed at solo content and business communicators; Business fits teams of up to five editors that need shared branding and protected links. It is a weaker match for someone seeking a generous free dashboard builder or unlimited screenshot conversion without a paid plan.
Pros and cons
Pros
- Broad import path: CSV, Excel, pasted data, Google Sheets, and chart screenshots cover both raw-data and reconstruction workflows.
- Useful narrative layer: AI headlines, insights, and takeaways connect chart creation with explanation.
- Flexible publishing: Link, image, and live-embed sharing works across reports, newsletters, and websites.
- Controlled team presentation: Business adds shared branding, password protection, and up to five editors.
Cons
- Restrictive Free tier: Three charts, 50 lifetime AI actions, JPEG-only export, and no dashboard creation limit it to evaluation and light use.
- Screenshot quotas: Imports stop at 400 monthly on Pro and 800 per editor on Business.
- Limited collaboration on Pro: Pro includes only one editor, making Business the first genuine team plan.
Alternatives
Datawrapper is the better pick for a free, established chart-and-map publishing workflow with PNG downloads and web embeds, accepting attribution on its Free plan.
Understand suits readers who want scrollytelling with unlimited stories, CSV upload, and public sharing in its free Starter tier.
ArcGIS StoryMaps is an alternative web option for map-led story presentations and offers a free public account with usage limits.
BStreams is worth considering when collaborator counts and file storage matter more than Graphtelling's AI chart narration.
Datastory fits teams seeking free visualizations with monthly AI credits and open-data downloads, or a paid per-user plan.
Flourish is a strong alternative for unlimited free projects and stories with its full template range, though public free publishing includes attribution.
Infogram offers a different route to interactive charts, maps, pages, and online publishing, with its Basic tier limited by projects and pages.
Juicebox is a paid option for search-focused visual analysis, starting at $119 per seat per month.
For a broader shortlist, see Data Storytelling Tools.
Verdict
Graphtelling is a good choice for creators and small teams that want editable charts, AI-assisted interpretation, and annotated dashboards with straightforward web publishing. Start with the seven-day Pro trial to confirm the import and dashboard workflow, then choose Pro for solo work or Business for shared branding and protected team publishing. Look elsewhere if a capable free dashboard builder, larger free quotas, or deeper collaboration is more important than keeping chart creation and narrative in one workspace.
Verdict
Graphtelling brings chart creation, AI-generated takeaways, and dashboard sharing into one web tool. Check the chart and screenshot-import caps, and note that dashboard building is not included in the Free plan.
Questions
Is Graphtelling free?
Yes. The Free plan costs nothing and includes three charts total, 50 one-time AI actions, JPEG export, and Graphtelling branding.
How much do the paid plans cost?
Pro is €10.00 per month billed yearly at €120 billed yearly, or €15/mo monthly. Business is €20.00 per month billed yearly at €240 billed yearly, or €30/mo monthly.
What platforms does Graphtelling support?
Graphtelling is available on the web.
Can I try Pro before paying?
New workspaces start with seven days of Pro without a credit card. The trial is capped at five charts and 30 screenshot imports.
What can I import?
Graphtelling accepts CSV, Excel, pasted spreadsheet data, Google Sheets, and screenshots of existing charts.
Can I share or publish charts?
Dashboards can be shared by link or image, and charts can be published through a live embed link on websites, newsletters, or CMSs.
Facts from Graphtelling's own pages
- AI features
- AI can uncover insights, improve headlines, and generate takeaways; paid plans make these features unmetered. · graphtelling.com, 7 Oct 2026
- Audience
- The Pro plan is described for creators, marketers, and founders; Business adds team access for up to five editors. · graphtelling.com, 7 Oct 2026
- Branding
- The Brand Kit includes logos, palettes, fonts, and saved style presets on Pro and Business. · graphtelling.com, 7 Oct 2026
- Chart types
- All plans include 14 chart types and tables. · graphtelling.com, 7 Oct 2026
- Dashboards
- Dashboards combine linked charts with text, arrows, shapes, images, and animations, and can be shared by link, image, or embed. · graphtelling.com, 7 Oct 2026
- Data import
- It accepts CSV, Excel, pasted spreadsheet data, Google Sheets, and screenshots of existing charts. · graphtelling.com, 7 Oct 2026
- Free limits
- The Free plan allows 3 charts and 50 one-time AI actions; it permits JPEG export and viewing shared dashboards, but not building dashboards. · graphtelling.com, 7 Oct 2026
- Publishing
- Charts can be embedded on websites, newsletters, or CMSs using a live embed link. · graphtelling.com, 7 Oct 2026
- Purpose
- Graphtelling turns spreadsheet data and chart screenshots into editable charts with AI-generated headlines and insights. · graphtelling.com, 7 Oct 2026
- Security and data
- The maker says data is stored securely, is never shared, and charts and data can be deleted at any time. · graphtelling.com, 7 Oct 2026
- Support
- The pricing comparison lists best-effort email support on Free, a 48-hour response on Pro, and a 24-hour response plus dedicated support on Business. · graphtelling.com, 7 Oct 2026
- Trial
- New workspaces start with 7 days of Pro without a credit card; the trial is capped at 5 charts and 30 screenshot imports. · graphtelling.com, 7 Oct 2026
- Usage limits
- Pro includes 400 screenshot imports monthly and Business includes 800 per editor monthly; when reached, screenshot import pauses without overage billing. · graphtelling.com, 7 Oct 2026
Where Graphtelling stands on Freedom251
- Data Storytelling Tools#11 of 22