Do these 3 things before closing this tab:
1Repair Windows errors before they cause bigger problems2Fix the driver behind crashes, sound loss and screen glitches3Clear out junk files and repair common Windows errorsA dashboard can show a reassuring p99 while users encounter slow requests because it may be averaging per-instance p99 values instead of calculating a percentile from the combined request population. Percentiles cannot generally be averaged to produce a service-wide percentile. With Prometheus histograms, aggregate the observations’ buckets first, then calculate p99.
Why averaging per-instance p99 values gives the wrong answer
A p99 is a rank in a particular population: 99% of the observations in that population are at or below the reported value. Each instance’s p99 describes that instance’s requests, not the combined set of requests handled by every instance. Taking an arithmetic average of those local p99 values does not reconstruct the p99 across all requests.


As an Amazon Associate I earn from qualifying purchases.
Prometheus’s histograms and summaries documentation warns that, in its worked example, “averaging the quantiles yields statistically nonsensical values.” The underlying issue is that the quantile values do not contain the distribution of observations needed to calculate a new quantile.
The Tool Desk
Outbyte PC Repair FREERepair Windows errors before they cause bigger problemsFix Now →Outbyte Driver Updater FREEFix the driver behind crashes, sound loss and screen glitchesFind Drivers →This is especially relevant when a dashboard combines summary quantiles from replicated processes. A summary can expose a streaming quantile from each process, but those precomputed quantiles generally cannot be combined into a meaningful service-wide quantile. Histograms retain bucket counts that can be aggregated before computing the quantile.
#1 Best Overall
Calculate p99 from aggregated Prometheus histogram buckets
Classic histograms
For a service-wide p99 over five minutes, aggregate the rates of the classic histogram bucket series while retaining the le label, then pass the result to histogram_quantile():
histogram_quantile(0.99, sum by (le) (rate(http_request_duration_seconds_bucket[5m])))Classic histograms expose cumulative bucket counters in series ending in _bucket. The le label identifies each bucket’s inclusive upper bound. Prometheus needs those boundaries to calculate the quantile, so the aggregation must preserve le. The PromQL function documentation describes histogram_quantile() and its requirements.
The example combines every series that differs only by labels not retained in the aggregation. If the result should remain separated by a dimension such as job or service, include it in the grouping:
Crashes, No Sound, or Screen Glitches?
Random freezes, missing sound and display glitches usually trace back to one bad driver. Find and replace yours safely.Free scan · under a minutePC Slower Than It Used to Be?
A free scan shows the junk files, broken settings and background clutter dragging Windows down - then fixes them in one click.Free scan · Windows 10 & 11histogram_quantile(0.99, sum by (job, le) (rate(http_request_duration_seconds_bucket[5m])))Native histograms
Native histograms are aggregated as histogram samples, without a separate le label:
Rank #3

- ✅【All-in-One Professional Kit with Sturdy Case】This premium network tool kit comes in a lightweight yet heavy-duty case that keeps all tools securely organized. Perfect for easy transport and storage, it’s your go-anywhere solution for home, office, server rooms, engineering projects, and network installations.
- ✅【Complete Tool Set for Pros & DIYers】Equipped with a high-performance Cat6A/Cat6/Cat5e/Cat5 pass-through crimper, wire tracker, 110/88 punch down tool, network stripper, wire cutter, 10 Cat6 pass-through connectors, and RJ45 boots. Everything you need for reliable and lasting connections.
- ✅【Versatile Ethernet Crimper with Tool-Free Adjustment】Master cable making with this multi-function crimping tool. Works with both pass-through and non-pass-through RJ45/RJ11/RJ12 connectors. Also strips, cuts, and crimps metal dovetail clips & terminals. The unique rotating knob allows quick adjustments—no screwdriver needed!
- ✅【Ergonomic 110/88 Punch Down Tool】Features a comfortable grip and interchangeable, reversible blades for 110 and 110/88 standards. Makes clean terminations in one smooth action—ideal for Cat6a, Cat6, Cat5e, and Cat5 cables.
- ✅【Smart Wire Tracker & Cable Tester】Quickly locate breaks and identify wires across connected devices like routers, switches, and PCs. Supports tracking of RJ11, RJ45, and other metal cables (with adapter). Tests network and telephone lines for opens, shorts, miswires, and reversed connections.
histogram_quantile(0.99, sum by (job) (rate(http_request_duration_seconds[5m])))The exact support and query behavior depend on the Prometheus release in use. Check the query function documentation and feature-flag documentation for the deployed version.
What the query’s window and labels mean
The [5m] range in rate() sets the time window used to calculate the bucket rates. A five-minute p99 is not a lifetime percentile or a statement about every request: it summarizes the histogram observations represented by that window and the selected series.
Rank #4
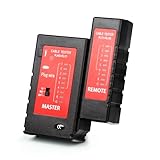
- 2-in-1 network cable tester is a useful tester tool. It allows you to test CAT5, CAT5e, CAT6, CAT6A and patch cords that terminate with RJ45 connectors. And you can also test telephone continuity with this cat cable tester.
- Power your device conveniently with either a Micro-USB cable or 9V battery. And Portable & Durable-The tester is small in size and lightweight, Carried around anywhere without any hassle; the chassis is made of much better quality plastic, nice and solid.
- Separated Structure-The ethernet tester can be easliy slide into two separated parts. And you can still use it where you are testing runs.
- Fast/Slow Testing- The gear to change testing speed is on the master, support fast and slow detect speed, giving you more flexibility. it features an easy-to-read LED indicator display with markings that correspond to the connection test result.
- Pair with Electrical Devices - The network & cable testers can easily detect shorts, opens and cross-pairs. And If you make patch cables or punch down Ethernet cables this is a great tester to quickly check that the cable is wired correct, there are no shorts, and all wires are connected.
The grouping labels define which series become one population. Grouping only by le combines all other label values, which can hide a slower route, region, job, or customer segment inside an otherwise healthy service-wide result. To investigate a report, preserve the relevant dimensions in the grouping or query those segments separately. Prometheus documents the effects of rate() and grouping in its query functions reference.
Recommended Free Tools
Why a histogram-derived p99 is still an estimate
A histogram does not record the exact duration of every request in its buckets. For a classic histogram, if the requested quantile falls between two bucket boundaries, Prometheus estimates its position by assuming observations are uniformly distributed within the bucket containing the quantile. The result is therefore an estimate whose usefulness depends partly on how the buckets divide the latency range.
Best Value

- VERSATILE CABLE TESTING: Cable tester for data (RJ45) terminated cables and patch cords, ensuring comprehensive testing capabilities
- LARGE BACKLIT LCD: Backlit LCD display enables easy reading of pin-to-pin wiremap results, even in low-lit areas
- COMPREHENSIVE FAULT DETECTION: Test for Open, Short, Miswire, Split-Pair faults, Cross-over, and Shield, providing thorough fault detection
- INTUITIVE USER INTERFACE: User-friendly interface with three buttons and simple, easy-to-identify test responses, ensuring a smooth testing experience
- MULTIPLE TONE GENERATOR STYLES: Tone on a single wire, wire pair, or all 8 conductor wires using the multiple style tone generator (solid/warble); requires probe Cat. No. VDV500-123 (sold separately)
Wide buckets around the tail can make a p99 less precise. Check that boundaries resolve the latency ranges that matter to your service objectives, rather than relying on a bucket layout that is too coarse where the tail falls. Also check the bucket counter data: classic histogram bucket counts should be non-decreasing as their upper bounds increase.
If the quantile lands in the highest classic bucket, Prometheus returns the upper bound of the second-highest bucket. A configured range that does not cover the tail you need to investigate can therefore produce a result that fails to describe the slowest requests usefully. See the histogram guidance for the interpolation and bucket behavior.
Independent reader supportYour contribution helps us test, update, and keep practical guides available for everyone.Classic and native histograms compared
| Property | Classic histogram | Native histogram |
|---|---|---|
| Aggregation for a quantile | Aggregate bucket rates and retain le. |
Aggregate histogram samples directly; no le grouping is needed. |
| Representation | Separate cumulative bucket series with configured boundaries. | Composite histogram samples; standard exponential schemas are supported. |
| Quantile interpolation | Linear interpolation within the bucket containing the quantile. | Standard exponential buckets use exponential interpolation outside the zero bucket; custom buckets use linear interpolation, and the zero bucket uses linear interpolation. |
| Version consideration | Check the query behavior documented for the Prometheus release you run. | Verify native histogram support and behavior against the deployed Prometheus release. |
Prometheus describes these metric types in its metric types documentation and native histograms specification. Documentation and feature support can evolve, so use the references for the version in your environment when validating a query.
Quick Recap
Check these things when p99 looks fine but users complain
- Inspect what is being aggregated. Confirm the query calculates a quantile from histogram data rather than averaging summary series labeled
quantile="0.99". - Aggregate before calculating the quantile. For classic histograms, apply
rate()to the bucket series, sum across the intended instances while retainingle, and then callhistogram_quantile(). For native histograms, aggregate the histogram samples using the appropriate query form. - Confirm the population. Check the rate window and grouping labels. Compare the service-wide query with relevant routes, jobs, regions, or customer segments instead of assuming they all behave alike.
- Inspect bucket boundaries near the tail. Determine whether the p99 falls into a wide bucket and whether the configured range reaches the latencies at issue; classic histogram interpolation estimates values within a bucket.
- Check the operational threshold directly. If the question is whether requests met a latency target, consider examining the fraction below that threshold as well as a percentile. Prometheus’s histogram guide demonstrates threshold-based Apdex calculations.
- Verify the Prometheus version. If the metric is a native histogram, validate its availability and query behavior against the release actually deployed.
Sources
- Prometheus: Histograms and summaries
- Prometheus: Query functions
- Prometheus: Metric types
- Prometheus: Native histograms specification
- Prometheus: Feature flags
Product prices and availability are accurate as of the date/time indicated and are subject to change. Any price and availability information displayed on Amazon at the time of purchase will apply.




