What’s actually slowing this PC down?
Pick the symptom - the matching free tool is one click away.
Weak or inconsistent carbon quantum dot (CQD) fluorescence rarely has one universal fix. The signal can depend on what is actually emitting, how well the sample was purified, its concentration and pH, aggregation, and the optical settings used to measure it. Start by repeating a controlled measurement, then vary one factor at a time; do not assume that changing pH or diluting the sample will help every formulation.
Why can CQD fluorescence be weak or inconsistent?
“Carbon quantum dot” describes a broad family of materials, not a single emitter with one established fluorescence mechanism. Reviews discuss emission associated with the carbon core, surface states, molecular species, and crosslink-related structures. Which explanation applies can depend on the preparation, so a bright spectrum alone does not prove that the carbon dots themselves produced the light.


As an Amazon Associate I earn from qualifying purchases.
Several effects can overlap. A sample may contain fluorescent byproducts, its emitting surface groups may respond to pH, or concentrated particles may quench one another. Aggregation and close packing can also open non-radiative pathways that reduce emitted light. Separately, different excitation wavelengths or instrument settings can produce spectra that are difficult to compare.
Free tools Windows power users keep installed
One-click scans. No signup required.
Common causes and useful checks
| Possible cause | What to check | What the check can tell you |
|---|---|---|
| Residual fluorescent molecules or uncertain sample identity | Review the synthesis route, purification, and characterization; for bottom-up products, investigate whether low-molecular-weight fluorescent byproducts contribute to the signal. | Whether the measured emission can reasonably be attributed to the intended dot population. |
| Concentration-dependent quenching or inner-filter effects | Measure a dilution series with the same matrix and optical setup. | Whether apparent emission changes with concentration. An increase on dilution makes concentration-related effects plausible, but does not identify which mechanism is responsible. |
| pH-dependent surface chemistry | Measure and record pH, then compare controlled conditions appropriate to the sample and experiment. | Whether emission or dispersion changes with pH for this formulation; it does not establish a universal optimum. |
| Aggregation, storage, or matrix effects | Check for changes with storage, solvent, ionic strength, or processing; compare dispersed and solid or concentrated material where relevant. | Whether physical state or matrix conditions may be affecting emission. |
| Different excitation or measurement settings | Keep acquisition settings fixed and, when useful, collect an excitation/emission map. | Whether the apparent inconsistency reflects excitation-dependent emission or a change in measurement conditions. |
Other mechanisms described in a recent review abstract include dynamic and static quenching, Förster resonance energy transfer (FRET), photoinduced electron transfer (PET), and the inner filter effect. These are possibilities to distinguish with suitable experiments, not diagnoses that can be made from a weak signal alone.
#1 Best Overall

- Cutting-Edge XRF Technology: Incorporates advanced X-Ray Fluorescence Spectrometry (XRF) technology, providing the latest in non-destructive metals elemental analysis. Stay on the forefront of analytical capabilities for accurate and efficient results.
- Versatile Applications: Tailored for diverse applications, from swift and accurate ore sample analysis to environmental surveys of soil composition, alloy analysis for quality control, and compliance checks for exports to the European Union.
- Efficient Scrap Recycling: Facilitates seamless scrap metal recycling and sorting through on-site analysis. Enables quick and reliable decision-making for buyers and sellers, ensuring quantitative analysis of various metal components for efficient material identification and sorting.
- Compliance and Safety Assurance: Tailored to meet the rigorous standards of industries such as power plants, machinery, and petrochemicals. Conduct alloy material identification (PMI), incoming material inspection, and inventory management, Adapt to American Society for Testing and Materials (ASTM) standards.
- Data Management Excellence: Features cross-platform data management, including the Q-CLOUD TM function. With software-linked data transfer capabilities, users can effortlessly transmit data via USB2.0 or export to Excel, providing a user-friendly experience for efficient data handling and reporting.
How to troubleshoot a weak signal step by step
- Repeat a matched baseline. Use replicate aliquots and fixed instrument settings. Keep the excitation wavelength, emission scan range, slit widths, gain, integration time, cuvette and path length, solvent or matrix, and sample temperature constant wherever those controls are available. Record the settings so a repeat measurement can be compared meaningfully.
- Make a small dilution series. Keep the solvent or matrix and optical setup unchanged while measuring each concentration. If apparent emission rises as the sample is diluted, concentration-dependent self-quenching or inner-filter effects are plausible explanations to investigate. Do not carry a concentration threshold from one CQD formulation over to another.
- Measure and document pH. Compare controlled pH conditions within a range suitable for the sample and its intended use. Surface-group protonation can affect emission and colloidal behavior, but reported pH responses vary between materials. A pH meter helps establish what condition was measured; the instrument itself does not restore fluorescence.
- Check physical state and matrix. Note whether the dispersion changes during storage or after changes in solvent, ionic strength, or processing. If you test filtration or another dispersal treatment, retain an untreated control and record possible material losses: removing aggregates may also remove some dots. For solid samples, close packing may matter, but a strategy reported for one formulation is not automatically suitable for another.
- Revisit purification and identity. Choose separation and characterization steps appropriate to the synthesis route. For bottom-up preparations in particular, test whether low-molecular-weight fluorescent byproducts could be contributing to the signal before attributing emission to the carbon core. A 2019 review by Navneet C. Verma, Aditya Yadav, and Chayan K. Nandi warns that “Insufficient purification and incomplete characterization pose a serious problem for attributing photoluminescence properties to carbogenic nanodots, especially those synthesized by bottom-up approaches.”
- Map excitation and emission when needed. Some CQDs show excitation-dependent emission, while others behave more independently of excitation. Compare spectra with consistent acquisition settings, and report both the excitation wavelength and emission range rather than describing a sample with a single unqualified brightness observation.
How to tell whether the fluorescence actually improved
Define what “better” means before adjusting the sample. Raw fluorescence intensity, photoluminescence quantum yield, and fluorescence lifetime are different measurements and should not be treated as interchangeable. Intensity can change with concentration, sample geometry, or instrument settings even when the underlying emission efficiency has not changed. Compare like with like: matched conditions for intensity, and the appropriate measurement method for quantum yield or lifetime.
Record at least the synthesis route and purification, concentration, pH, solvent or matrix, ionic strength if relevant, storage state, physical form, excitation wavelength, emission window, and acquisition settings. This makes comparisons interpretable and helps separate a change in the sample from a change in how it was measured. The exact protocol still depends on the formulation and application.
Rank #2
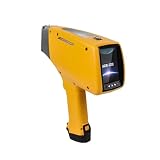
- Gold (Au), silver (Ag), tungsten (W), Palladium (Pd)
- Focus on ppm with percentage (%) displays, spectral or peak intensity (count rate) or user-determined units
- USB interface can set user permissions, generate customized reports and print analysis reports to download measurement data and its spectrum in EXCEL format
- All elements from Ti(titanium) to U(uranium) can be analyzed
- Color display, high resolution 3.5 "TFT industrial touch screen, large icon graphical interface, clear visible under any light conditions
What published results can—and cannot—tell you
A 2026 study reported an average quantum yield of 36.8 ± 0.9% (n=3) for one nitrogen-doped CQD preparation under that study’s optimized synthesis conditions. It is a result for that preparation and protocol, not a general CQD benchmark or a yield to expect from a different sample.
PC Slower Than It Used to Be?
A free scan shows the junk files, broken settings and background clutter dragging Windows down - then fixes them in one click.Free scan · Windows 10 & 11Outdated Drivers Are Slowing You Down
One free scan finds every outdated or missing driver and matches the right update for your exact hardware.Free scan · exact hardware matchLikewise, reviews establish that preparation, pH, concentration, physical state, and optical conditions can matter, but they do not provide a single adjustment that will repair every weak or variable sample. Without a sample’s synthesis route, matrix, concentration, and measurement configuration, the responsible answer is a controlled troubleshooting sequence—not a guaranteed setting.
Quick Recap
Best Value
Product prices and availability are accurate as of the date/time indicated and are subject to change. Any price and availability information displayed on Amazon at the time of purchase will apply.




