Recharts is a popular charting library for React because it makes line charts, bar charts, pie charts, and other visualizations easy to build with declarative components. In a standard React web app, it works well with SVG, browser layout APIs, and familiar CSS styling, which is many developers look for ways to reuse it when building React Native apps.
React Native, however, does not run in a browser by default, and Recharts was designed for the web rather than native iOS and Android rendering. That means it cannot usually be dropped into a React Native screen the same way it can be used in a React web project.
As an Amazon Associate I earn from qualifying purchases.
The practical path depends on your app’s needs: you can use Recharts through React Native Web, embed it inside a WebView, or choose a charting library built specifically for React Native. Each approach has tradeoffs around setup complexity, performance, styling, responsiveness, and touch interaction support.
What Recharts Is and Why React Native Support Is Limited
Recharts is a charting library for React that focuses on declarative, component-based data visualization. Instead of manually drawing paths, axes, legends, and tools, you compose charts with components such as <LineChart>, <BarChart>, <XAxis>, <Tooltip>, and <ResponsiveContainer>. This makes it popular in React dashboards, admin panels, analytics screens, and reporting tools where the app runs in a browser.
#1 Best Overall
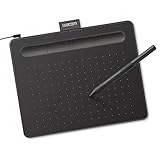
- Wacom Intuos Small Graphics Drawing Tablet: Enjoy industry leading tablet performance in superior control and precision with Wacom's EMR, battery free technology that feels like pen on paper
- Works With All Software: Wacom Intuos tablet can be used in any software program to explore new facets of digital creativity; draw, paint, edit photos/videos, create designs, and mark up documents
- What the Professionals Use: Wacom's industry leading pen technology and pen to paper feeling makes it the preferred drawing tablet of professional graphic designers
- Software and Training Included: Only Wacom gives you software with every purchase. Register your Intuos tablet and gain access to some of the best creative software and Wacom's online training
- Wacom is the Global Leader in Drawing Tablet and Displays: For over 40 years in pen display and tablet market, you can trust that Wacom to help you bring your vision, ideas and creativity to life
The limitation in a React Native project comes from how Recharts renders charts. Recharts is built for the web platform and relies on browser primitives, especially SVG and DOM behavior. A typical Recharts chart ultimately produces web elements such as <svg>, <div>, and browser-managed event layers. React Native, on the other hand, does not render to the browser DOM. Its core components, such as View, Text, and ScrollView, map to native iOS and Android views rather than HTML elements.
This platform mismatch means you cannot usually install Recharts in a standard React Native app and expect it to work inside a normal native screen. Components like ResponsiveContainer expect browser layout measurements, tools expect web-style pointer and mouse interactions, and SVG output expects a DOM-compatible rendering environment. Even if your JavaScript bundle can import the package, the rendering layer is not the same as React in a browser.
Where Recharts fits well
- React web apps: dashboards, SaaS admin tools, reporting interfaces, and browser-based analytics pages.
- React Native Web apps: projects that target the browser using React Native-style components but still run in a DOM environment.
- Embedded web content: mobile apps that display a web page or HTML document inside a WebView.
Where Recharts does not fit directly
- Pure native iOS and Android screens: standard React Native views do not provide the DOM and browser SVG environment Recharts expects.
- Gesture-heavy mobile charts: pinch, pan, long-press, and native scroll coordination often require mobile-specific chart libraries.
- Offline-first native interfaces: embedding a web chart can add complexity around asset loading, sizing, and communication between native code and web content.
In practice, Recharts support in React Native depends on the target runtime. If your app is using React Native Web and the chart screen runs in a browser, Recharts can be a reasonable choice because the DOM and SVG APIs are available. If your app is a native iOS or Android app, Recharts is usually used indirectly through a WebView, where the chart is rendered as web content inside the mobile application.
That distinction matters when choosing a setup. A WebView can be useful when you already have Recharts charts in a web codebase and want to reuse them in a mobile shell. It can also work for static reports, simple analytics views, or internal tools where visual consistency with a web dashboard matters more than deep native interaction. For highly interactive mobile charts, native-friendly libraries such as those based on react-native-svg, Skia, or platform-specific rendering are often a better match.
Using Recharts with React Native Web
Recharts can work well in a React Native codebase when the target is the web through React Native Web. In this setup, React Native components are rendered to browser DOM elements, and Recharts can render its SVG-based charts as it normally would in a standard React web application. This approach is most suitable when your project ships a web version alongside iOS and Android, or when your chart-heavy screens only need to run in the browser.
A typical setup uses React Native Web through a framework such as Expo for Web, Next.js with React Native Web, or a custom Webpack/Vite configuration. Once the web target is configured, Recharts is installed like any other web dependency:
npm install recharts
You can then create a web-only chart component that imports from Recharts and renders inside a screen shared by your React Native app. For example, a simple line chart may use LineChart, Line, XAxis, YAxis, Tool, and ResponsiveContainer. The component should be loaded only for the web platform, because these Recharts components depend on browser APIs and SVG rendering behavior that are not available in native iOS or Android React Native runtimes.
Free tools Windows power users keep installed
One-click scans. No signup required.
Use platform-specific files
The cleanest way to avoid native compatibility errors is to split the chart implementation by platform. React Native supports platform-specific filenames, so you can create a Recharts version for web and a native fallback for mobile:
Rank #2

- Word-first 16K Pressure Levels: The upgraded stylus features 16,384 levels of pressure sensitivity and supports up to 60 degrees of tilt, delivering smoother lines and shading for a natural drawing experience. With no battery or charging needed, it operates like a real pen, making it easy for beginners to create effortlessly. This functionality helps novice artists develop their skills and explore their creativity without the intimidation of complex tools
- Designed for Beginners: This drawing pad desinged with 8 customizable shortcuts for both right and left-hand users, express keys create a highly ergonomic and convenient work platform
- Perfectly Adapted for Android: The XPPen Deco 01 V3 art tablet supports connections with Android devices running version 10.0 and above. It is recommended to download the XPPen Tools Android application, which adapts to your smartphone's screen aspect ratio, ensuring accurate mapping. It also supports mapping on Android screens with different aspect ratios in portrait mode
- Large Drawing Space, Bigger Bold Inspiration: This expansive drawing pad has10 x 6.25-inch helps you break through the limit between shortcut keys and drawing area
- Easy Connectivity for Beginners: The Deco 01 V3 offers USB-C to USB-C connectivity, plus adapters for USB C. This ensures easy connection to various devices, allowing beginner artists to set up quickly and focus on their creativity without compatibility concerns. Whether using a laptop, tablet, or desktop, the Deco 01 V3 provides a seamless experience, making it an ideal choice for those just starting their digital art journey
SalesChart.web.tsx— imports and renders Recharts components.SalesChart.native.tsx— renders a native chart library, placeholder, or simplified mobile view.SalesChart.tsx— optional shared wrapper if you want to centralize props and data formatting.
With this structure, imports such as import SalesChart from './SalesChart' resolve to the correct file depending on the platform. The web build receives the Recharts implementation, while iOS and Android avoid loading Recharts entirely. This matters because even an unused import can break a native bundle if it pulls in DOM-specific code.
Keep shared chart data separate
When supporting both web and native, keep your chart data preparation independent from the rendering library. A shared helper can normalize API responses into objects such as { month: 'Jan', revenue: 12000 }. The web component can pass that data to Recharts, while the native component can pass the same data to a React Native charting library. This reduces duplicated business and makes it easier to switch chart renderers later.
| Use case | React Native Web with Recharts fit |
|---|---|
| Web dashboard built from a React Native codebase | Strong fit |
| Shared app with separate mobile chart implementation | Good fit |
| Single chart component expected to run unchanged on iOS, Android, and web | Poor fit |
| Native-only mobile app | Not recommended |
Styling also needs a web-aware approach. Recharts expects dimensions from its parent container, especially when using ResponsiveContainer. On React Native Web, ensure the wrapping View has an explicit width and height, or a style that resolves to real browser dimensions. Without a defined height, the chart may render as blank even though the data and component code are valid.
Using Recharts with React Native Web is best viewed as a web-target strategy, not a universal React Native charting solution. It lets you reuse parts of your React Native application architecture while taking advantage of Recharts for browser-based screens. For native iOS and Android screens, plan a separate renderer or a mobile-focused chart library rather than trying to force Recharts into the native runtime.
Embedding Recharts in a WebView
If your app is a true native React Native app rather than a React Native Web project, the most practical way to use Recharts is to render it inside a WebView. Recharts depends on browser technologies such as the DOM, SVG layout, CSS, and web event handling, so it cannot run directly in the native React Native rendering tree. A WebView gives Recharts the browser-like environment it expects while allowing the surrounding screen, navigation, and app state to remain native.
The usual setup is to install react-native-webview, create a small web bundle that contains your Recharts component, and load that bundle inside the WebView. In an Expo project, this typically starts with installing the package through Expo-compatible tooling. In a bare React Native project, you install the package and ensure native linking is configured correctly for iOS and Android. The chart itself can be served from a remote URL, loaded from a local HTML file, or injected as an HTML string using the WebView’s source prop.
Common WebView approaches
- Remote chart page: Host a React page that renders Recharts and point the WebView to its URL. This is simple to update, but it requires network access unless you add caching.
- Local static bundle: Build the chart as a small static web app and package it with the mobile app. This works offline and keeps the chart version tied to the app release.
- Injected HTML: Generate an HTML document string that includes the chart container, scripts, styles, and serialized data. This can work for simple dashboards, but large inline bundles become harder to maintain.
For data-driven charts, communication between React Native and the WebView matters. The native side can pass initial data through query parameters, injected JavaScript, or the HTML payload. For ongoing updates, use postMessage from the chart page to send events back to React Native, and injectJavaScript or WebView message handlers to push new data into the chart. For example, a user tapping a bar in a Recharts bar chart can trigger a web-side event that posts the selected category and value to the native screen, where you can open a detail view or update other native UI elements.
Do these 3 things before closing this tab:
1Clear out junk files and repair common Windows errors2Scan for outdated or missing drivers - takes under a minute3Repair Windows errors before they cause bigger problemsCompatibility considerations
A WebView-based chart should be treated like an embedded mini web app. Set a fixed container height or calculate one from the device dimensions, because Recharts responsive containers need a measurable parent. Test both iOS and Android, since WebView rendering, font smoothing, scroll behavior, and touch handling can differ. Tools and hover-based interactions should be redesigned for touch: prefer taps, long presses, visible labels, or custom tooltip state instead of relying on mouse hover. If the chart is inside a scrollable React Native screen, check gesture conflicts between vertical scrolling and horizontal chart interaction.
Rank #3

- Customize Your Workflow: The 6 customizable press keys on Huion H640P drawing tablet for pc let you assign your most-used commands—like undo, zoom, brush switch, or save—so you can keep your hands on the tablet and your mind on the art. Whether you're a digital painter switching brushes, or a comic artist zooming in and out, these keys keep your workflow smooth and uninterrupted. Plus, the Huion driver lets you save different shortcut profiles for different apps, so you never have to reconfigure when switching software.
- Professional Pen Performance: Huion H640P drawing pad for computer comes with the battery-free PW100 stylus that's always ready when inspiration strikes. With 8192 levels of pressure sensitivity, every light sketch, or bold stroke responds naturally to your hand—just like a real pen. The 5080 LPI resolution and 233 PPS report rate deliver lag-free, precise strokes, so you can draw confidently without second-guessing your cursor. The pen side buttons help you switch between pen and eraser instantly.
- Compact and Portable: Huion H640P computer graphics tablet features a compact, ultra-portable design at just 0.3 inches thin and 0.61 lbs light, so it slides easily into your backpack—perfect for sketching in coffee shops, taking notes in class, or editing on the go between home and studio. The 6x4 inch active area offers enough room for natural pen movements while fitting comfortably on crowded desks, or lecture hall seats.
- Stable Compatibility: Huion H640P graphic drawing tablet works seamlessly with Mac, Windows, Linux PCs, and Android smartphones/tablets (OS version 6.0 or later). Left-handed friendly, and you just need to flip the tablet and adjust the settings in the driver. Please note: H640P does NOT support iPhone/iPad.
- Move Beyond the Mouse: Huion Inspiroy H640P is a pen tablet that replaces your mouse for more natural, precise control. Freehand draw, take notes, or even play OSU—everything you do with a mouse, you can do better with a pen. The precise tip makes it ideal for detailed photo editing, graphic design, or signing PDF. Meanwhile, the ergonomic pen grip helps you avoid the strain that comes from hours of using a mouse.
This approach is useful when you already have Recharts components in a web dashboard and want to reuse them in a mobile app, or when your chart requirements rely on Recharts-specific features and styling. It is less suitable for highly interactive, animation-heavy, or performance-sensitive screens, because a WebView adds memory overhead and creates a boundary between native layout and chart rendering. For simple line, bar, pie, and progress charts, a React Native-native library is often easier to style, test, and integrate with gestures.
Setting Up a Basic Recharts Chart
Once you have chosen a compatible rendering path, such as React Native Web or a WebView, the actual Recharts component looks the same as it would in a regular React app. Recharts expects to run in a DOM-capable environment, so the setup below applies to the web portion of your project rather than to native iOS or Android views rendered directly by React Native.
Install Recharts in the package that renders the chart UI. If you are using an Expo or React Native Web setup, this may be the same app package. If you are embedding charts in a WebView, it is often cleaner to keep the chart in a small separate React web app or an HTML bundle that the WebView loads.
The Tool Desk
Outbyte PC Repair FREEClear out junk files and repair common Windows errorsFree Scan →Outbyte Driver Updater FREEFix the driver behind crashes, sound loss and screen glitchesFind Drivers →npm install recharts
A basic line chart uses a data array, a chart container, axes, and one or more visual series. The following component can be used in a React Native Web screen or inside the React app that is rendered in a WebView:
import {

  LineChart,

  Line,

  XAxis,

  YAxis,

  CartesianGrid,

  Tool,

  ResponsiveContainer

} from 'recharts';
const data = [
{ month: 'Jan', revenue: 1200 },
{ month: 'Feb', revenue: 1800 },
{ month: 'Mar', revenue: 1500 },
{ month: 'Apr', revenue: 2200 },
{ month: 'May', revenue: 2600 }
];
export function RevenueChart() {
return (
<div style={{ width: '100%', height: 280 }}>
<ResponsiveContainer>
<LineChart data={data}>
<CartesianGrid strokeDasharray="3 3" />
<XAxis dataKey="month" />
<YAxis />
<Tooltip />
<Line
type="monotone"
dataKey="revenue"
stroke="#2563eb"
strokeWidth={2}
dot={{ r: 4 }}
/>
</LineChart>
</ResponsiveContainer>
</div>
);
}
For React Native Web, you can place this component in a screen that is rendered on the web target. The surrounding layout may still use React Native primitives such as View and Text, but the chart itself relies on web elements and SVG. In many projects, teams isolate chart components into web-only files, for example RevenueChart.web.tsx, and provide a native fallback in RevenueChart.native.tsx.
Recommended Free Tools
For a WebView-based setup, build the chart as a web page and load it from either a hosted URL or bundled local HTML. The React Native side passes data through query parameters, injected JavaScript, postMessage, or a local JSON payload. The chart page then renders Recharts normally inside the WebView document.
Rank #4

- PLEASE NOTE:XPPen Artist13.3 Pro drawing tablet Need to connect with computer,you need to use it with your computer or laptop, the 3 in 1 cable is included
- Drawing Tablet with Screen: Tilt Function- XPPen Artist 13.3 Pro supports up to 60 degrees of tilt function, so now you don't need to adjust the brush direction in the software again and again. Simply tilt to add shading to your creation and enjoy smoother and more natural transitions between lines and strokes
- Graphics Tablets: High Color Gamut- The 13.3 inch fully-laminated FHD Display pairs a superb color accuracy of 88% NTSC (Adobe RGB≧91%,sRGB≧123%) with a 178-degree viewing angle and delivers rich colors, vivid images, and dazzling details in a wider view. Your creative world is now as powerful as it is colorful
- Drawing Pad: One is enough- The sleek Red Dial on the display is expertly designed with creators in mind, its strategic placement allows for natural drawing postures. With just one wheel, you can effortlessly zoom in and out, adjust brush sizes, and flip the canvas—all tailored to suit the habits of everyday artists. The 8 customizable shortcut keys allow you to personalize your setup, streamlining your workflow and enhancing creative efficiency
- Universal Compatibility & Software Support:supports Windows 7 (or later), Mac OS X 10.10 (or later), Chrome OS 88 (or later), and Linux systems. Fully compatible with major creative software including Photoshop, Illustrator, SAI, and Blender 3D. Register your device to access additional programs like ArtRage 5 and openCanvas for expanded creative possibilities.
Typical setup patterns
- React Native Web: Use Recharts directly in web-only components and render them only for the browser target.
- Hosted WebView: Deploy a small React chart app and load it with
react-native-webview. - Bundled WebView: Package a static HTML/JavaScript chart bundle with the mobile app for offline-friendly dashboards.
- Native fallback: Use a React Native chart library for iOS and Android while keeping Recharts for web dashboards.
Keep the chart container dimensions explicit. ResponsiveContainer needs a parent with measurable width and height, so a missing height often results in a blank chart. In WebView scenarios, set the document body and root element dimensions as well, then size the WebView from React Native using normal layout styles.
Handling Styling, Responsiveness, and Touch Interactions
After a Recharts chart is rendering inside a React Native project, the next challenge is making it feel acceptable on a phone-sized screen. Recharts was designed around browser layout, SVG rendering, CSS, and mouse-driven interactions, so styling and behavior need to be handled differently depending on whether you are using React Native Web or a WebView. In both cases, the chart should be treated as a web surface embedded in or alongside a native app interface, rather than as a fully native React Native component.
For layout, avoid assuming a fixed desktop width. Recharts commonly uses ResponsiveContainer, but it only works when its parent has a measurable width and height. In React Native Web, that means the surrounding view must resolve to real dimensions through CSS-compatible styles. In a WebView, the HTML document should define a viewport meta tag, set the chart container width to 100%, and pass the desired height from React Native when needed. A practical mobile chart often has a fixed height such as 220-320 pixels, while its width follows the device or card container.
What’s actually slowing this PC down?
Pick the symptom - the matching free tool is one click away.
Styling considerations
- Use simple SVG shapes: Lines, bars, and areas usually perform better than dense scatter plots or heavily customized labels.
- Increase spacing for mobile: Axis labels, legends, and tooltips that look fine on desktop can become cramped on smaller screens.
- Prefer app-controlled colors: Pass theme values into the chart configuration so the chart matches dark mode, brand colors, and screen backgrounds.
- Limit visible data points: Aggregate, paginate, or horizontally scroll long datasets instead of rendering hundreds of points at once.
Touch interaction deserves special attention. Recharts tools, hover states, and active dots are primarily browser interaction patterns. On mobile web and inside a WebView, touch can trigger some tooltip behavior, but it may not feel the same as native chart gestures. Users may expect tap, drag, pinch, or long-press behavior, while Recharts components are more naturally aligned with mouse move events. If the chart is informational, simple tap-to-inspect behavior may be enough. If the chart is central to the app experience, test gestures carefully on actual iOS and Android devices rather than relying only on a browser preview.
When embedding Recharts in a WebView, communication between the native layer and the chart can also affect interaction design. For example, tapping a bar can call window.ReactNativeWebView.postMessage to send the selected value back to React Native, where you can open a native bottom sheet or update surrounding UI. This often produces a better mobile experience than trying to make every tooland detail panel live inside the chart itself. Keep the WebView content focused on rendering the visualization, and let the React Native screen handle navigation, filters, and larger interface elements.
| Concern | Practical approach |
|---|---|
| Small screens | Use fixed chart height, responsive width, fewer labels, and shorter legends. |
| Dynamic themes | Pass colors and font settings from React Native into the web chart configuration. |
| Touch tooltips | Validate behavior on real devices and consider native overlays for detailed values. |
| Performance | Reduce data density, avoid complex custom renderers, and update chart data deliberately. |
Responsiveness is not only about resizing the SVG. It also includes deciding which information is worth showing at each screen size. A desktop dashboard might show axes, grid lines, a legend, data labels, and mulle series at once. On mobile, the same chart may work better with one or two series, abbreviated tick labels, and a separate native control for switching metrics. Recharts can still be useful in these scenarios, especially when you already share chart code with a web app, but the final design should be optimized for mobile constraints rather than copied directly from the web version.
Independent reader supportYour contribution helps us test, update, and keep practical guides available for everyone.React Native-Friendly Alternatives to Recharts
If your app is primarily a native iOS and Android application, a React Native charting library is usually a better fit than Recharts. Recharts depends on browser-oriented SVG behavior and the DOM, while native chart libraries are built around React Native primitives, gesture handling, and mobile layout constraints. This matters most when charts need to feel interactive, load quickly, work offline, or appear inside scroll-heavy screens.
PC Slower Than It Used to Be?
A free scan shows the junk files, broken settings and background clutter dragging Windows down - then fixes them in one click.Free scan · Windows 10 & 11Outdated Drivers Are Slowing You Down
One free scan finds every outdated or missing driver and matches the right update for your exact hardware.Free scan · exact hardware matchThe right alternative depends on the kind of charts you need, how much customization is required, and whether your project already uses SVG or Skia. Some libraries focus on simple dashboards, while others provide lower-level building blocks for highly customized visualizations. Before choosing one, check support for your chart types, toolbehavior, animation performance, Expo compatibility, TypeScript definitions, and maintenance activity.
Best Value
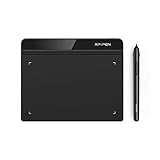
- Battery-Free Pen: StarG640 drawing tablet is the perfect replacement for a traditional mouse! The XPPen advanced Battery-free PN01 stylus does not require charging, allowing for constant uninterrupted Draw and Play, making lines flow quicker and smoother, enhancing overall performance
- Ideal for Online Education: XPPen G640 graphics tablet is designed for digital drawing, painting, sketching, E-signatures, online teaching, remote work, photo editing, it's compatible with Microsoft Office apps like Word, PowerPoint, OneNote, Zoom, Xsplit etc. Works perfect than a mouse, visually present your handwritten notes, signatures precisely
- Compact and Portable: The G640 art tablet is only 2 mm thick, it's as slim as all primary level graphic tablets, allowing you to carry it with you on the go
- Chromebook Supported: XPPen G640 digital drawing tablet is ready to work seamlessly with Chromebook devices now, so you can create information-rich content and collaborate with teachers and classmates on Google Jamboard’s whiteboard; Take notes quickly and conveniently with Google Keep, and effortlessly sketch diagrams with the Google Canvas
- Multipurpose Use: Designed for playing OSU! Game, digital drawing, painting, sketch, sign documents digitally, this writing tablet also compatible with Microsoft Office programs like Word, PowerPoint, OneNote and more. Create mind-maps, draw diagrams or take notes as replacement for mouse
Popular options for React Native charts
- Victory Native: A strong option if you want a declarative API similar to web charting libraries. It supports common chart types such as line, bar, area, pie, scatter, and candlestick charts. It is useful for dashboards that need flexible styling without building every chart from scratch.
- react-native-svg-charts: Built on
react-native-svg, this library provides line, bar, pie, stacked area, and progress charts. It can work well for straightforward visualizations, although teams should review current maintenance status before starting a new project with it. - react-native-chart-kit: A simple choice for quick dashboards and prototypes. It includes line charts, bar charts, pie charts, contribution graphs, progress charts, and bezier line charts. It is less flexible than lower-level libraries, but fast to set up for standard mobile reporting screens.
- react-native-gifted-charts: A practical library for polished mobile charts with animations and common business chart patterns. It supports line, bar, pie, donut, area, population pyramid, and stacked charts, making it suitable for finance, fitness, and analytics apps.
- Shopify React Native Skia: A powerful rendering option for teams that need custom, high-performance charts. Skia is not a chart library by itself, but it gives you a fast drawing layer for building bespoke visualizations, animated graphs, and dense datasets.
Choosing between Recharts and native alternatives
| Scenario | Recommended approach |
|---|---|
| Shared web and mobile-web dashboard | Use Recharts with React Native Web when the target is browser rendering. |
| Existing Recharts dashboard must appear inside a mobile app | Embed it in a WebView, especially if reuse is more valuable than native interaction. |
| Native mobile app with standard charts | Use Victory Native, react-native-chart-kit, or react-native-gifted-charts. |
| Highly custom animated charts or large datasets | Build with React Native Skia or another low-level rendering approach. |
For most production React Native apps, native-friendly charting tools reduce friction around layout, gestures, and performance. Recharts is still valuable when you are targeting the web or reusing an existing browser dashboard, but it should not be the default choice for native screens. If the chart is part of the app’s core user experience, choose a library designed for React Native and test it early on real devices with realistic data volumes.
Frequently Asked Questions
Can I use Recharts directly in a React Native app?
Not in a normal native React Native screen. Recharts is built for the web and renders charts using DOM and SVG APIs that React Native does not provide. It works best in React Native Web or inside a WebView, but for fully native mobile screens you should usually choose a React Native chart library.
What is the easiest way to show a Recharts chart in React Native?
The easiest practical option is to render the Recharts chart inside a WebView. You can create a small HTML page or bundled web app that loads React, Recharts, and your chart data, then display it with react-native-webview. This approach keeps Recharts working as intended, but you need to handle sizing, data passing, and communication between the WebView and the native app.
Quick wins for a faster PC:
Clear out junk files and repair common Windows errorsFree Scan →Scan for outdated or missing drivers - takes under a minuteDriver Scan →Repair Windows errors before they cause bigger problemsFix Now →Should I use React Native Web if my project needs Recharts?
React Native Web is a good fit if your app is primarily targeting browsers or you are sharing UI between web and mobile. In that setup, Recharts can run on the web version because it has access to browser APIs. It does not make Recharts automatically work in native iOS or Android views, so you still need a WebView or a native charting alternative for mobile builds.
What are the main downsides of using Recharts in a WebView?
A WebView adds an extra rendering layer, which can affect startup time, memory usage, and gesture handling compared with native components. Touch interactions such as tools, scrolling, and zooming may need extra tuning, especially when the chart is inside a scrollable screen. It can still be a good choice when you already have Recharts charts on the web and want to reuse them with minimal changes.
What should I use instead of Recharts for native React Native charts?
For native mobile apps, consider libraries such as react-native-svg-charts, victory-native, react-native-gifted-charts, or chart components built on react-native-svg. These libraries are designed for React Native rendering and usually integrate better with native layouts, gestures, and performance constraints. Choose them when the chart is a core part of the mobile experience rather than a reused web visualization.
Bottom Line
Recharts is a strong choice for React web apps, but it is not built for React Native’s native rendering environment. If you need to use it in a mobile project, the most practical route is usually rendering it inside a WebView or sharing chart code with a web surface, while accepting the trade-offs in performance, styling, and native integration.
For most production React Native apps, start by evaluating native-friendly chart libraries such as victory-native, react-native-svg-charts, or other SVG/Skia-based options. Choose Recharts only when web parity matters more than fully native behavior; otherwise, pick a React Native charting solution that fits your data, interaction, and performance needs.
Quick Recap
Product prices and availability are accurate as of the date/time indicated and are subject to change. Any price and availability information displayed on Amazon at the time of purchase will apply.




