What’s actually slowing this PC down?
Pick the symptom - the matching free tool is one click away.
Lauterbach has added COQOS hypervisor awareness to its TRACE32 debug and trace tools, giving embedded developers clearer visibility into systems that run mulle operating systems and software partitions on a shared hardware platform. The update helps engineers inspect and trace virtualized targets with an understanding of the COQOS Hypervisor’s structure, rather than treating the system as a single opaque execution environment.
This is especially relevant for automotive and other safety-critical applications, where teams increasingly consolidate mixed-criticality workloads onto fewer processors. With hypervisor-aware debugging, developers can more effectively analyze guest operating systems, partition behavior, scheduling interactions, and cross-domain issues that affect performance, reliability, and certification readiness.
As an Amazon Associate I earn from qualifying purchases.
What COQOS Hypervisor Awareness Adds to TRACE32
Lauterbach’s COQOS hypervisor awareness extends TRACE32 so developers can inspect a virtualized embedded target in terms that match its actual runtime architecture. Instead of seeing only raw CPU state, physical addresses, and low-level exception activity, TRACE32 can identify COQOS-managed virtual machines, partitions, guest contexts, and the relationship between guest execution and hypervisor scheduling. This gives engineers a clearer view of how consolidated software stacks behave on a single SoC, especially when several operating systems or safety domains share processor cores, memory, and peripherals.
COQOS, developed by OpenSynergy, is widely used to consolidate automotive and embedded workloads such as Linux-based infotainment, AUTOSAR environments, Android, real-time operating systems, and safety-related applications. With hypervisor awareness in TRACE32, debugging can move across these layers without losing context. A developer can correlate a breakpoint or trace event with the active guest, the virtual CPU involved, and the partition in which the code is running. This is especially useful when a fault appears in one domain but is triggered by timing, resource contention, or inter-partition communication involving another domain.
#1 Best Overall

- Jumper lead wires are made of high quality silicone material. Silicone can help with longevity and easy of use. Both ends are female connector. Length: 30cm.
- Test hook adopts high quality and conductive performance materials. The front end of the hook is retractable with a spring, so objects can be firmly hooked.
- Suitable for testing IC or repairing cell phone and other mini electronic products. It also has good protection performance and a relatively short circuit to prevent touching of the foot.
- Product bonus 20PCS round stickers. They can be attached to the test hooks to distinguish different channels when using logic analyzer.
- Package include: 10PCS test hook clips, 10PCS silicone jumper leads, 1PC velcro strap, 20PCS stickers, 1PCS white transparent storage box.
Added visibility across virtualized software layers
The enhancement makes TRACE32 more effective for systems where traditional single-OS debugging is no longer sufficient. In a non-virtualized target, mapping an address to a process, thread, or symbol is usually straightforward. In a hypervisor-based design, the same physical machine may host mulle guest address spaces, different kernel models, and separate scheduling policies. COQOS awareness helps TRACE32 interpret these layers so that developers can inspect target state from the perspective of the hypervisor as well as from individual guests.
- Partition recognition: TRACE32 can present execution state in relation to COQOS partitions or virtual machines, helping teams identify which software domain was active during a stop, exception, or trace sample.
- Guest-aware symbol handling: Developers can work with symbols and address translations belonging to a selected guest OS instead of manually resolving mappings across virtual and physical memory.
- Virtual CPU context: Debug sessions can distinguish between guest execution contexts and the underlying processor state managed by the hypervisor.
- Cross-domain trace interpretation: Trace data can be analyzed with awareness of guest switches and hypervisor activity, making timing analysis more meaningful on consolidated systems.
- Improved fault localization: Errors can be traced back to the affected guest, partition, or interaction path rather than being treated as an undifferentiated system-level failure.
For teams building mixed-criticality platforms, this means fewer blind spots during bring-up and integration. A single hardware platform may combine ASIL-oriented control software, non-safety applications, communication services, and rich user interfaces. TRACE32 with COQOS awareness helps engineers verify that each domain behaves as expected while also observing the shared execution environment. The result is a debug and trace workflow that better reflects the architecture of modern automotive ECUs, domain controllers, and zonal controllers, where virtualization is used to isolate functions without mullying hardware platforms.
Why Hypervisor-Aware Debugging Matters in Embedded Systems
Virtualization is now common in embedded designs that need to combine functions with different safety, security, and real-time requirements on a single processor. In an automotive domain controller, for example, a safety-related AUTOSAR Classic stack, a Linux-based infotainment service, and a diagnostic or connectivity partition may all run side by side under a hypervisor such as COQOS. This consolidation reduces hardware cost and system weight, but it also changes how engineers must inspect software behavior. A debugger that only sees raw cores, memory, and registers cannot easily explain which guest OS, virtual machine, or partition is active at a given moment.
Hypervisor-aware debugging gives TRACE32 the context needed to interpret a virtualized target correctly. Instead of treating the system as one opaque execution environment, the debugger can relate low-level processor state to hypervisor-managed entities such as guests, virtual CPUs, address spaces, and scheduling events. That context is essential when a fault appears in one partition but is triggered by timing, resource contention, or inter-VM communication involving another partition. Without this visibility, teams may lose time switching between separate logs, OS-level tools, and hardware traces while trying to reconstruct what actually happened.
Challenges without hypervisor awareness
- Ambiguous execution context: a program counter or exception address may be visible, but the engineer still has to determine which guest or partition owned it.
- Complex memory translation: virtualized systems can involve guest virtual, guest physical, and host physical address mappings, making manual analysis slow and error-prone.
- Hidden scheduling effects: latency issues may arise when the hypervisor preempts a guest, migrates work, or handles traps and interrupts.
- Fragmented fault analysis: crashes can cross boundaries between guest software, drivers, shared memory, and hypervisor services.
- Limited trace interpretation: hardware trace data is less useful if it cannot be correlated with the active virtual machine and operating system state.
These problems are especially significant in embedded systems because many faults are timing-dependent and difficult to reproduce. A virtualized target may pass functional tests under light load but fail when mulle guests compete for CPU time, memory bandwidth, interrupts, or shared peripherals. Hypervisor-aware trace helps engineers identify whether a deadline miss came from application code, guest OS scheduling, hypervisor activity, or interference from another partition. This is much more practical than relying only on instrumentation inside each guest, which can disturb timing and may not capture events below the guest OS level.
For safety-critical developers, the value is not only faster debugging but also stronger evidence during integration. Mixed-criticality platforms depend on isolation assumptions: a non-safety guest should not corrupt the safety partition, and a lower-criticality workload should not cause unacceptable timing behavior in a higher-criticality function. With COQOS awareness in TRACE32, teams can examine partition behavior with a system-level view while still drilling down into guest-specific execution. That supports more confident root-cause analysis, clearer integration testing, and earlier detection of defects that only appear when the full consolidated platform is running.
Rank #2

- 【Perfect Fit For MSO5000 Series Oscilloscope】This logic probe is designed for use with Rigol MSO5000 series oscilloscopes. — no complicated setup or additional converters required.
- 【Gold Plated Connection For Signal Integrity】This logic probe delivers enhanced conductivity and corrosion resistance.
- 【Plug & Play】Simply connect the probe to the front-panel logic analyzer port— the oscilloscope will automatically recognize the digital channels.
- 【Sturdy】Built with high-quality cable and strain-relieved connectors to withstand daily lab and field use.
- 【Professional After-sales Service】If you have any questions, please don't hesitate to contact us.
Key Debug and Trace Capabilities for Virtualized Targets
With COQOS hypervisor awareness, TRACE32 can present a virtualized target as a structured system rather than as a flat stream of low-level CPU activity. Developers can inspect the hypervisor context, identify active guest operating systems, and correlate execution with the partitions configured on the platform. This is especially useful when a single SoC runs a real-time OS for control functions, Linux or Android for high-level services, and dedicated safety partitions under the same hypervisor.
Recommended Free Tools
The integration allows engineers to move between system-wide visibility and guest-specific debugging without losing context. Instead of manually decoding address translations, virtual CPU states, or partition switches, TRACE32 can associate debug information with the correct guest or execution domain. That reduces ambiguity when investigating faults that only appear during interaction between virtual machines, shared devices, or timing-sensitive workloads.
Core capabilities enabled in TRACE32
- Hypervisor-aware task and context visibility: Developers can see which guest, virtual CPU, or partition is currently executing and relate that state to the underlying physical cores.
- Guest OS debugging: TRACE32 can support debugging within individual guest operating systems while preserving awareness of the surrounding COQOS virtualization layer.
- Partition-aware breakpoints: Breakpoints and watchpoints can be applied with better precision, helping avoid unintended stops in another guest that uses similar virtual addresses.
- Address translation support: Virtual-to-physical mapping can be interpreted in the context of the active guest, simplifying memory inspection across isolated domains.
- Trace correlation across guests: Execution traces can be analyzed with knowledge of partition switches, interrupts, and scheduling activity, making cross-domain timing behavior easier to understand.
For multicore targets, this awareness becomes even more valuable. A consolidated embedded platform may schedule different guests on different cores, migrate virtual CPUs, or dedicate cores to safety-relevant workloads. TRACE32 can help developers follow these execution paths and connect core-level trace data with the virtualized software architecture. That makes it easier to determine whether a latency spike comes from a guest workload, a hypervisor scheduling decision, interrupt handling, or contention around a shared hardware resource.
Tracing also supports analysis beyond functional correctness. Engineers can examine startup sequences, partition handovers, inter-VM communication, and fault propagation paths. In a mixed-criticality design, these details matter because a non-critical infotainment or connectivity workload must not disturb deterministic control software. By aligning trace records with COQOS hypervisor information, TRACE32 gives teams a practical way to validate isolation assumptions and investigate issues that are difficult to reproduce through software logging alone.
Another practical advantage is earlier root-cause isolation during board bring-up and integration. When a guest crashes, stalls, or shows unexpected timing behavior, developers can inspect the guest state and the hypervisor state from the same debug environment. This shortens the path from symptom to cause, particularly when the issue involves boot configuration, memory assignment, interrupt routing, virtual device behavior, or interactions between safety and non-safety partitions.
The Tool Desk
Outbyte PC Repair FREERepair Windows errors before they cause bigger problemsFix Now →Outbyte Driver Updater FREEScan for outdated or missing drivers - takes under a minuteDriver Scan →Benefits for Automotive and Safety-Critical Development
For automotive and safety-critical teams, Lauterbach’s COQOS hypervisor awareness in TRACE32 addresses a practical challenge: modern ECUs increasingly run several software domains on one high-performance SoC. An instrument cluster, ADAS function, gateway service, AUTOSAR Adaptive application, and legacy control component may share processors, memory controllers, accelerators, and I/O paths while remaining isolated by the COQOS hypervisor. Debugging such a platform without hypervisor context can make faults appear as disconnected CPU events. With awareness of COQOS partitions and guests, TRACE32 can present execution in terms that match the system architecture engineers actually designed.
Rank #3
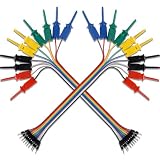
- Packing included: 2set Logic Analyzer Test Hook Clip with line
- Material: plastic metal, Length : Approx. 20cm / 7.87", Clip color : Red, black, yellow, blue and green 2 pieces each.
- Stretchable pure copper clip, higher conduction efficiency, with spring on the front end, strong elastic force, can hold testing point firmly.
- Capable of grabbing very small points like SOIC IC legs, Male pin easily inserts into breadboard or other standard 0.1" connector, help you connect the chip, pins, etc. easily.
- Applications: It can be used to precision circuit testing / power supply, connected with a jumper wire, it is an ideal tool used with power or multimeter.
This is especially valuable for mixed-criticality consolidation. A safety-related partition must be analyzed without losing sight of neighboring non-safety workloads that may influence timing, interrupt latency, cache pressure, or shared resource behavior. Hypervisor-aware visibility helps developers verify that partitions are scheduled as expected, that context switches occur at the intended points, and that a guest OS is not being investigated in isolation from the virtualization layer beneath it. For teams working under ISO 26262 or similar safety processes, this improves the quality of evidence gathered during integration, fault analysis, and regression testing.
Areas where developers gain practical value
- Clear partition context: Engineers can distinguish activity belonging to individual COQOS guests or partitions, reducing ambiguity when several operating systems execute on the same target.
- Faster root-cause analysis: Timing anomalies, exceptions, deadlocks, and unexpected interrupts can be correlated with hypervisor scheduling and guest execution rather than inspected only at a low CPU level.
- Safer consolidation decisions: Teams can evaluate whether critical and non-critical functions coexist cleanly on shared hardware, supporting consolidation of ECU functions without sacrificing observability.
- Improved trace interpretation: Trace data becomes more actionable when execution flow can be mapped to virtualized software components, tasks, interrupts, and guest environments.
- More efficient collaboration: Platform teams, application developers, safety engineers, and integration teams can work from the same target view instead of exchanging partial logs from separate tools.
Automotive programs also benefit from the ability to debug across development phases. Early in bring-up, engineers can inspect low-level boot behavior, hypervisor initialization, and guest startup. During integration, they can follow interactions between Linux, AUTOSAR, RTOS, or bare-metal domains. Closer to release, trace-based analysis can support performance tuning and regression checks under realistic workloads. This continuity matters because many timing and isolation defects do not appear in a single software component; they emerge only when the full virtualized stack runs on production-like hardware.
For safety-critical development, the central benefit is confidence. Hypervisor-aware TRACE32 support for COQOS gives teams a more precise view of what happened, where it happened, and which software context was active at the time. That reduces guesswork during defect investigation and helps preserve separation between components with different assurance levels. In consolidated vehicle platforms, where fewer ECUs are expected to host more functions, this level of debug and trace visibility can directly support more predictable integration, stronger validation workflows, and shorter stabilization cycles.
Supported Workflows for Guest OS and Partition Analysis
With COQOS hypervisor awareness in TRACE32, developers can move beyond treating a virtualized target as a single opaque execution context. The debugger can present the system in terms that match the deployed architecture: hypervisor, virtual machines, guest operating systems, tasks, address spaces, and assigned resources. This is especially useful when a consolidated embedded platform runs an AUTOSAR Adaptive stack beside a real-time OS, Linux-based services, or safety partitions with strict isolation requirements.
A typical workflow starts by connecting TRACE32 through the target’s debug interface and loading the COQOS-aware extension so the tool can interpret hypervisor data structures. Once active, engineers can select a guest or partition as the current context, inspect its virtual-to-physical address mapping, and load the matching symbols for the guest kernel, middleware, or application. Breakpoints and watchpoints can then be placed with awareness of the selected guest context, reducing ambiguity when identical virtual addresses exist in different virtual machines.
Common analysis tasks
- Guest OS bring-up: Step through early boot code, verify CPU assignment, check device access, and confirm that the guest reaches its expected scheduler or application entry point.
- Partition isolation checks: Inspect memory regions, interrupt routing, and access permissions to confirm that one guest cannot unintentionally affect another.
- Cross-domain fault analysis: Correlate a failure in one guest with hypervisor events, shared resource activity, or interrupts originating from another partition.
- Real-time behavior analysis: Trace scheduling behavior across virtual CPUs and physical cores to identify latency introduced by virtualization, contention, or misconfigured priorities.
- Mixed-symbol debugging: Load and switch symbol contexts for multiple guests so call stacks, variables, and source lines remain meaningful during system-level debugging.
For partition-level investigation, TRACE32 can help developers examine what is happening before and after a world switch, virtual interrupt delivery, or scheduler decision. This matters when a symptom appears inside a guest application but the cause sits at the hypervisor boundary, such as a missing virtual interrupt, an incorrect memory mapping, or a device assignment mismatch. Instead of relying only on logs from each guest, the engineering team can inspect the complete execution state from the hardware level upward.
Rank #4

- 【High-Speed 8-Channel Analysis】Captures digital signals at up to 24MHz across 8 channels, enabling precise debugging of complex protocols like I2C, SPI, and UART—ideal for advanced STEM projects without the limitations of basic 4-channel models.
- 【User-Friendly Design】Base module and breakout board simplify connections to breadboards, microcontrollers, and other setups.
- 【Logic Level Expansion Board】Breaks out all 8 channels to 2.54mm male pins and pads for alligator clips, enabling flexible and secure connections in diverse projects.
- 【Logic Level Breadboard Adapter】 Easily connects the logic analyzer to breadboards, providing direct and convenient access to all 8 channels for prototyping and testing.
- 【Dual USB Connectivity】Comes with both USB-A and Type-C cables for universal compatibility with older PCs, modern laptops, and devices, ensuring hassle-free plug-and-play across Windows, Mac, Linux, and Ubuntu.
The same workflow supports trace-based analysis when intermittent timing issues cannot be reproduced with breakpoints alone. Engineers can collect instruction flow, task switches, exception entries, and hypervisor transitions, then filter the data by guest or partition. In practice, this allows teams to answer concrete questions such as which guest owned a core at the time of a missed deadline, whether a safety partition was preempted by a non-safety workload, or whether an I/O service domain delayed a dependent application.
Free tools Windows power users keep installed
One-click scans. No signup required.
These capabilities are particularly relevant during integration, when separately developed software components are first combined on a shared ECU or domain controller. Platform teams can validate that the COQOS configuration matches the intended system design, while application teams can continue debugging in familiar OS-specific views. The result is a workflow that supports both deep hypervisor analysis and day-to-day guest debugging without forcing developers to dismantle the virtualized architecture they are trying to validate.
Independent reader supportYour contribution helps us test, update, and keep practical guides available for everyone.Impact on System Integration and Time-to-Market
Adding COQOS hypervisor awareness to TRACE32 can shorten the most difficult phase of a virtualized embedded program: bringing separately developed software domains together on the final hardware. In a consolidated cockpit, ADAS controller, gateway, or zonal ECU, teams often integrate a safety partition, one or more real-time control workloads, Linux-based services, and communication stacks on the same multicore SoC. Without visibility across the hypervisor boundary, integration problems can appear as generic stalls, missed deadlines, unexplained resets, or guest OS crashes. TRACE32’s hypervisor-aware view gives engineers a more direct path from a system-level symptom to the responsible partition, virtual CPU, task, interrupt, or shared resource interaction.
This is especially valuable when defects only emerge under realistic load. A timing issue may not be visible when a guest is debugged in isolation, but it can surface once other partitions begin using cache, memory bandwidth, DMA, Ethernet, PCIe, or shared accelerators. With COQOS awareness, TRACE32 can correlate execution state across the virtualized platform rather than forcing developers to reconstruct events from disconnected logs. That reduces the amount of trial-and-error usually needed to determine whether a failure comes from application code, guest OS behavior, hypervisor scheduling, device assignment, interrupt routing, or inter-partition communication.
Faster integration cycles
For system integrators, the main gain is a tighter debug loop. Engineers can inspect the active guest context, switch views between partitions, analyze traces in relation to virtualized execution, and compare expected scheduling behavior with what actually occurred on the target. This helps integration teams verify that consolidation has not introduced unintended interference between mixed-criticality workloads. It also supports earlier detection of configuration errors, such as incorrect memory mappings, wrong device ownership, misrouted interrupts, or insufficient CPU allocation for a timing-sensitive domain.
Do these 3 things before closing this tab:
1Fix the driver behind crashes, sound loss and screen glitches2Repair Windows errors before they cause bigger problems3Scan for outdated or missing drivers - takes under a minute- Reduced handoff friction: platform teams, application teams, and safety teams can work from a shared target-level view instead of exchanging partial logs and assumptions.
- Earlier fault isolation: crashes, latency spikes, and missed deadlines can be narrowed to a guest, partition, or hypervisor interaction more quickly.
- Better regression analysis: trace data can reveal whether a new software build changes scheduling, interrupt load, or resource usage across virtual machines.
- More confident hardware bring-up: developers can validate virtualized software directly on production-like silicon, not only in simulation or host-based environments.
The time-to-market effect becomes clearer as projects scale. Automotive programs increasingly reuse common compute platforms across mulle vehicle lines, with different feature sets activated through software. A debugging environment that understands COQOS helps preserve that reuse model by making platform variants easier to validate. When a new guest OS image, middleware stack, or safety application is added, developers can examine its impact on existing partitions before late-stage integration testing exposes conflicts. This supports more predictable milestones for board bring-up, software integration, safety validation, and release candidate stabilization.
Best Value

- Logic probe with cable, leads and grabber clips
- Compatible with Rigol MSO5000 and DHO900 oscilloscopes
For safety-critical development, the benefit is not only speed but also evidence quality. Trace and debug sessions that show how partitions execute, interact, and remain isolated can support engineering reviews and defect investigations. While tool output does not replace safety analysis or certification work, it provides concrete target behavior that teams can use when assessing freedom from interference, temporal behavior, and system robustness. By making the virtualized runtime more transparent, TRACE32’s COQOS hypervisor awareness helps teams move from “the integrated system failed” to “this partition, event, or resource path caused the failure” with less delay, reducing schedule risk during the phase where embedded programs are most vulnerable to late surprises.
Frequently Asked Questions
What does COQOS hypervisor awareness add to TRACE32?
It lets TRACE32 understand the COQOS hypervisor structure instead of seeing only a flat low-level target. Developers can inspect guests, partitions, virtual CPUs, address spaces, and scheduling behavior with context that matches the virtualized system. This makes it easier to debug software running across mulle isolated domains on the same embedded processor.
Can developers debug guest operating systems and applications separately?
Yes, hypervisor awareness helps developers focus on a selected guest OS, partition, or execution context while still retaining visibility into the full target. This is useful when Linux, AUTOSAR, RTOS, and bare-metal components share one SoC. Teams can isolate faults in one domain without losing sight of interactions with the hypervisor or other guests.
Quick wins for a faster PC:
Fix the driver behind crashes, sound loss and screen glitchesFind Drivers →Clear out junk files and repair common Windows errorsFree Scan →Scan for outdated or missing drivers - takes under a minuteDriver Scan →How does this help with tracing mixed-criticality automotive systems?
TRACE32 can correlate trace data with virtualized execution contexts, making it clearer which guest or partition was running at a given time. That helps engineers analyze timing, task switches, interrupts, and cross-domain behavior in consolidated automotive platforms. It is especially valuable when safety-critical and non-critical workloads run side by side under COQOS.
Does hypervisor-aware debugging reduce integration time?
It can reduce time spent reproducing and isolating issues because engineers can inspect guest state, hypervisor state, and target trace data in one workflow. Integration teams can more quickly identify whether a fault comes from an application, guest OS, configuration issue, or virtualization boundary. This is useful late in development, when bugs often appear only under full system load.
Who benefits most from TRACE32 support for COQOS?
The main beneficiaries are teams building virtualized embedded systems for automotive, industrial, aerospace, and other safety-focused markets. It is particularly relevant for developers consolidating mulle ECUs or software domains onto high-performance processors. Debug access that understands COQOS helps these teams validate partitioning, timing behavior, and system interactions more efficiently.
Bottom Line
Lauterbach’s COQOS hypervisor awareness in TRACE32 gives developers clearer visibility into virtualized embedded systems, making it easier to debug and trace software across guest OSs, partitions, and mixed-criticality workloads. For teams working on consolidated automotive and safety-critical platforms, that visibility can reduce integration friction and help isolate issues faster.
If your roadmap includes domain controllers, zonal architectures, or other hypervisor-based designs, this support is worth evaluating early in the development cycle. Bringing hypervisor-aware debugging into the workflow can improve confidence before complex system behavior reaches late-stage validation.
Quick Recap
Product prices and availability are accurate as of the date/time indicated and are subject to change. Any price and availability information displayed on Amazon at the time of purchase will apply.




