To alert on healthtech failures with Node.js metrics polling, expose service and runtime metrics, scrape them from a monitor that can detect when the target disappears, and alert on sustained user-facing symptoms such as elevated errors or latency. Keep notification delivery separate from metric collection, and set polling and alert thresholds from the service’s objectives and safety process—not from a generic example interval.
What to measure in a Node.js healthtech service
Start with signals that show whether the service is working for users: request volume, failures, and latency. Prometheus recommends measuring request or query counts, errors, and latency for online-serving services. Count failed requests and total attempts separately so the error ratio can be calculated; a failure count without a denominator cannot show whether the failure rate is rising or simply reflects higher traffic. See the Prometheus instrumentation guidance.
As an Amazon Associate I earn from qualifying purchases.
Add runtime measurements when they help explain a service symptom. Node.js perf_hooks provides monitorEventLoopDelay(), which samples event-loop delay and reports it as a histogram in nanoseconds. Elevated delay can help distinguish a blocked or overloaded process from a dependency problem, but it is diagnostic context—not a substitute for user-facing error and latency metrics. Node’s v26.9.0 performance hooks documentation describes the API.
What’s actually slowing this PC down?
Pick the symptom - the matching free tool is one click away.
Node’s diagnostics channel can also provide instrumentation hooks for HTTP activity. The node:diagnostics_channel module supports named channels for diagnostic messages, including HTTP client and server lifecycle events. Use those events to observe activity and feed appropriate aggregate measurements; they do not automatically create a metrics endpoint or an alert. See the Node.js v26.10.0 diagnostics channel documentation.
#1 Best Overall

- Simple to Use Without a Subscription: No Bluetooth, Wi-Fi, cords or PC needed. Place the device near your smartphone. Monitor your heart by placing your fingers or thumbs on the silver KardiaMobile EKG sensors. Know in 30 seconds whether your heart rhythm is normal.
Keep metric labels bounded
Use labels for dimensions that help explain or route an alert, such as service, environment, or a bounded operation name. Avoid putting request IDs, user IDs, or other unbounded values in labels: each unique label combination creates another time series. Keep request-specific detail in logs or traces and link responders to those systems where appropriate. Prometheus explains this cardinality trade-off in its instrumentation practices.
How to poll a metrics endpoint reliably
Configure a monitoring system to scrape the Node.js service’s HTTP metrics endpoint. Choose the cadence based on the service’s objectives and how quickly responders need to know about a failure. Prometheus’s getting-started configuration shows a 15-second default scrape interval as an example; it is not a healthtech-wide recommendation or a threshold for safe detection. The Prometheus first-steps guide explains scrape targets and their health.
Rank #2
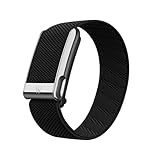
- What You Get - A 12-month membership, WHOOP MG device, a SuperKnit Luxe band, and a waterproof* Wireless PowerPack. Choose from a range of band and accessory combinations, and add a waterproof Wireless PowerPack for on-the-go charging.
- HSA/FSA Eligible - All 12-month WHOOP memberships and battery packs qualify for HSA/FSA reimbursement.
- Screenless, Distraction-Free - No screen, no buzzing notifications. WHOOP focuses entirely on your health and performance, with up to 14+ day battery life so you can wear it around the clock.
- Heart Screener with On-Demand ECG - Take an ECG reading from your wrist in seconds to check for signs of atrial fibrillation. Heart Screener gives you a medical-grade view of your heart rhythm whenever you need it.
- 24/7 Health Insights - WHOOP monitors your heart rate every second of every day, delivering personalized Sleep, Strain, Recovery, VO2 max, Menstrual Cycle, and Heart Rate insights along with a Real-time Stress Monitor that pinpoints your stressors and shows how your body responds in the moment, so you can make better decisions about training, rest, and daily performance.
Monitor the scrape itself independently from the values exported by the application. If the service is down, its last application metric may stop updating; an alert that looks only at metric values can miss the loss of telemetry. Track whether the target can be scraped and whether critical data has become stale or absent. Prometheus provides target health information in its interface, as described in the first-steps guide.
Keep the monitor’s own health visible as well. Prometheus documents /-/healthy and /-/ready management endpoints for checking Prometheus health and readiness. These endpoints indicate the state of the monitoring system, not the Node.js service being monitored.
Rank #3
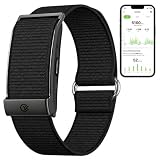
- Simple & Screen-Free Design – Easy to use and ultra-lightweight, comfortable for all-day wear without the distraction of a screen
- Powerful Health Monitoring – Accurately tracks heart rate, blood pressure, blood oxygen, HRV, sleep quality, and stress levels to help you better understand your body
- 100+ Sports Modes – Supports a wide range of fitness activities with precise tracking, making it your reliable companion for workouts and daily movement
- Ultra-Long Battery Life – Just 2 hours of charging powers up to 47 days of standby, so you can focus on your goals without constant recharging
- No Subscription Required – Enjoy all features with the free app, fast syncing, and easy Bluetooth connection—no hidden costs
Which conditions should trigger an alert?
Build a small set of alerts around sustained symptoms that matter to users, and use the service’s objectives and dependency failure modes to set thresholds. Prometheus advises alerting on symptoms associated with end-user pain rather than trying to detect every possible cause. That keeps pages actionable while leaving lower-level diagnostic signals available for investigation. See Prometheus alerting practices.
- Elevated error rate: alert when the proportion of failed requests or operations remains above the service’s defined objective.
- Excessive latency: alert when a user-relevant latency measure remains outside the service’s objective.
- Unavailable target: alert when the monitor cannot scrape the service.
- Missing critical telemetry: alert when a metric needed to assess service health is absent or stale.
There is no universal polling interval or numeric threshold established for healthtech services. Derive them from the service’s SLO, the consequences and duration of dependency failures, the intended use of the service, and the organization’s safety process. A generic configuration value cannot determine an appropriate clinical or operational response.
Rank #4

- Accurate and detailed EKG results - Records a medical-grade, six-lead EKG and provides FDA-cleared determinations of your heart rhythm in just 30 seconds.
- Six Leads, Six Times more Information: Detects six of the most common arrhythmias including AFib, Bradycardia, Tachycardia, Sinus Rhythm with Premature Ventricular Contractions (PVCs), Sinus Rhythm with Supraventricular Ectopy (SVE), and Sinus Rhythm with Wide QRS.
- 6L Max includes one year of KardiaCare: Membership is required to use this 6-lead EKG. You will be prompted to enter payment details when you create your account, but you will not be charged during the first year. Your membership renews after one year unless canceled.
- Board-Certified Cardiologist EKG Reviews - KardiaCare includes four free EKG reviews per year, available to use anytime during the year. Using your detailed 6-lead EKG results, cardiologists can detect over 20 arrhythmias, with results delivered in just 24 hours. Additional reviews can be purchased for $39 each
- Automatically Email Your EKG to Doctors or Anyone - KardiaCare enables you to set up automatic emails so that results from your EKGs will be emailed to anyone you choose.
Use pending time to filter brief blips
Prometheus alerting rules support a for duration: a condition must remain active through that period before the alert becomes firing. This can prevent a short-lived fluctuation from paging responders. The keep_firing_for setting can keep an alert firing after its condition stops matching, which may reduce flapping or premature resolution in some situations. Choose these durations alongside the alert’s objective and response needs; they affect when an alert changes state, not how quickly the underlying metric is collected. Rule behavior is documented in the Prometheus alerting rules reference.
Quick wins for a faster PC:
Scan for outdated or missing drivers - takes under a minuteDriver Scan →Repair Windows errors before they cause bigger problemsFix Now →Fix the driver behind crashes, sound loss and screen glitchesFind Drivers →How alert rules become responder notifications
Metric collection, rule evaluation, and notification delivery are distinct parts of the system. Prometheus evaluates alerting rules; Alertmanager manages notifications, including grouping, silencing, inhibition, and dispatch through configured channels. Configure labels such as service, environment, and severity to support routing, and include concise annotations that tell a responder what symptom is active and where to investigate. Prometheus describes this division in its alerting overview and Alertmanager documentation.
Best Value

- What You Get - A 12-month membership, WHOOP 5.0 device, a SuperKnit band, and a waterproof* Wireless PowerPack. Choose from a range of band and accessory combinations, and add a waterproof Wireless PowerPack for on-the-go charging.
- HSA/FSA Eligible - All 12-month WHOOP memberships and battery packs qualify for HSA/FSA reimbursement.
- Screenless, Distraction-Free - No screen, no buzzing notifications. WHOOP focuses entirely on your health and performance, with up to 14+ day battery life so you can wear it around the clock.
- Healthspan with Pace of Aging - Understand how your daily habits shape long-term health. Healthspan measures your WHOOP Age and Pace of Aging so you can take science-backed action to slow biological aging and extend your prime years.
- 24/7 Health Insights - WHOOP monitors your heart rate every second of every day, delivering personalized Sleep, Strain, Recovery, VO2 max, Menstrual Cycle, and Heart Rate insights along with a Real-time Stress Monitor that pinpoints your stressors and shows how your body responds in the moment, so you can make better decisions about training, rest, and daily performance.
A useful notification identifies the affected service or instance, states the measured symptom, and points to an investigation guide or relevant logs and traces. It should make the next action clear without embedding sensitive request-level data in metric labels or alert text.
Using Node.js diagnostic reports during investigation
Metrics identify that a symptom is occurring; diagnostic evidence can help explain why. Node.js diagnostic reports can include JavaScript and native stack information, heap statistics, platform details, and resource usage. The API documents report capture for uncaught exceptions, fatal errors, signals, and programmatic triggers. Reports support investigation but do not replace service metrics, target-health monitoring, or the notification path. See the Node.js v26.10.0 diagnostic reports documentation.
Protect diagnostic artifacts and metrics endpoints under the deployment’s access-control and data-handling policies. The Node.js API documentation describes report contents and triggers; it does not establish healthtech privacy or regulatory requirements. Apply the requirements relevant to the service and organization.
Choosing and validating a polling setup
When evaluating an implementation, check the capabilities that determine whether failures become visible and actionable:
- Detection timing: whether scrape cadence and alert pending time fit the service’s objectives and response needs.
- Independent monitoring: whether the monitor can report a target failure even when the application cannot export metrics.
- Missing-data handling: whether target-down and stale-telemetry conditions can be detected separately from bad metric values.
- Alert stability: whether pending and keep-firing behavior avoids noisy flapping without delaying a needed response.
- Notification controls: whether grouping, silencing, inhibition, routing, and escalation fit the responder workflow.
- Operational cost and context: whether metric cardinality is controlled and alerts point to useful diagnostic evidence.
Prometheus documentation describes these mechanisms, but it does not rank monitoring vendors or prescribe one deployment architecture for healthtech. Validate the complete path—from an instrumented symptom, through scraping and rule evaluation, to the responder’s notification—against the deployed Prometheus version and the service’s own operational and safety requirements.
Quick Recap
Product prices and availability are accurate as of the date/time indicated and are subject to change. Any price and availability information displayed on Amazon at the time of purchase will apply.




