Memory fragmentation can make a managed application behave as if it is short of memory even when some heap space is free: the free space may sit in gaps that cannot satisfy the allocations being requested. But a large heap, rising process memory, or a heap that does not shrink after garbage collection is not, by itself, proof of fragmentation. Diagnose the runtime, its collection behavior, and comparable memory measurements together.
What memory fragmentation means—and what it does not
A garbage collector reclaims objects that are no longer reachable from the application’s roots. Compaction is a separate operation: it moves reachable objects together and updates references so that free space is less scattered. A collection can reclaim memory without compacting it, and some areas of a managed heap may be left uncompacted because moving their contents is costly or constrained.
As an Amazon Associate I earn from qualifying purchases.
Fragmentation is unused space in gaps among live objects. Its practical effect depends on the size of those gaps, the size of incoming allocations, and whether the runtime can move the objects around them. A gap can be useful if a requested allocation fits; otherwise, free bytes may exist without being usable for that request.
That differs from live-set pressure. A large live set consists of reachable objects, so the collector cannot reclaim them. A high allocation rate can also cause collections to occur more often, even when fragmentation is not the cause. These conditions can coexist, but they call for different investigations.
#1 Best Overall

- [Color] PCB color may vary (black or green) depending on production batch. Quality and performance remain consistent across all Timetec products.
- DDR3L / DDR3 1600MHz PC3L-12800 / PC3-12800 240-Pin Unbuffered Non-ECC 1.35V / 1.5V CL11 Dual Rank 2Rx8 based 512x8
- Module Size: 16GB KIT(2x8GB Modules) Package: 2x8GB ; JEDEC standard 1.35V, this is a dual voltage piece and can operate at 1.35V or 1.5V
- For DDR3 Desktop Compatible with Intel and AMD CPU, Not for Laptop
- Guaranteed Lifetime warranty from Purchase Date and Free technical support based on United States
- Fragmentation: free space is distributed among gaps; allocation fit and compaction behavior matter.
- Live-set pressure: a large amount of memory remains reachable after collection.
- High allocation rate: the application creates objects quickly, potentially increasing collection frequency.
- Process-memory growth: the process may retain or reserve memory beyond the live managed heap.
Why a heap that stays large does not prove a problem
Heap size, committed memory, virtual address space, and resident process memory describe different things. In .NET, committed virtual memory can exceed the heap size because it includes memory made ready for allocation. Microsoft also notes that workstation GC with concurrent collection does not compact reclaimed objects, so heap size may remain the same or appear larger after collection. A heap that fails to shrink is therefore not enough to establish either a leak or fragmentation.
Compare measurements taken at consistent points in the collection cycle. Look at live or post-collection heap data, fragmentation, allocation rate, collection frequency, pause duration, and process memory together. If one dashboard labels heap, committed, virtual, and resident memory alike as “memory usage,” its trend may obscure the cause.
Rank #2

- Office Gaming Mini PC - UPGRADED GMKtec Nucbox M5 Ultra Series is equipped with the powerful AMD Ryzen 7 7730U processor, 8 Cores/16 Threads, Base 2.00GHz (Power Saving Quiet Mode) with Turbo Boost up to 4.50GHz (Performance Mode) in BIOS settings, Based on the ZEN 3+ architecture, this small but powerful mini pc delivers satisfying results in productivity, office work, and gaming. 35% Performance increase over AMD Ryzen 5 7430U/ Ryzen 7 5700U, 5600U, 5560U, 5500U.
- 16GB DDR4 RAM & 256GB PCIe SSD - Installed with DDR4 16GB RAM (1x16GB), the Nucbox M5 Ultra mini pc support expansion to 64GB RAM. Featured with 256GB M.2 2280 PCIe 3.0 SSD, support dual slot expansion to 4TB SSD. (Upgrades not included)
- DUAL NIC LAN 2.5G RJ45 - Fast Network Speeds: Enjoy up to 2500Mbps data transmission speed without worrying about lagging. Ideal for working, gaming, and surfing the internet. Great for Untangle, Pfsense or as a server office PC.
- Mini Desktop Computer with 4K Triple Screen Display - Nucbox M5 Ultra integrates AMD Radeon Graphics 8 Cores 2000 MHz GPU to deliver powerful graphics processing power to easily handle the demands of complex design software, 4K@60Hz UHD video editing, and playback. It can connect to 3 display screens simultaneously.
- Fast Internet WiFi 6E + BT5.2 Connection - GMKtec Mini PC with WiFi-6E Wireless, have 2.5G/5G/6G triple band, more faster and lower latency. Bluetooth 5.2 allowing you more quickly to connect other wireless devices (headset, mouse, keyboard, etc.) Interface features 2*USB3.2 ports, 2*USB2.0 ports, 1*HDMI 2.0 port(4K@60Hz), 1*USB-C port(PD/DP/DATA), 1*DP Port, 1*Audio 3.5mm (HP&MIC), 1*DC Power Port.
How to investigate the problem
- Identify the environment. Record the runtime and version, collector, operating system, container or process memory limit, and exactly what each memory reading represents: heap, committed, virtual, or resident memory.
- Choose a representative observation window. Use a repeatable workload and capture allocation rate, post-collection heap or live-set data, fragmentation by the runtime’s relevant heap area, collection frequency, pause durations or percentiles, and process RSS. Compare snapshots taken at equivalent points in collection cycles.
- Check runtime-specific causes and tradeoffs. For .NET, examine pinning, large object heap behavior, and large transient allocations. For Go, examine live-heap growth and how GOGC and the memory limit interact. For Java G1, evaluate pause goals alongside throughput.
- Change one relevant factor at a time. Test under representative, production-like load and judge the result against memory, latency, and throughput constraints. There is no universal GC setting established across these runtimes.
What to check in .NET
Read fragmentation in context
Microsoft documents fragmentation as free space divided by total allocated memory for a generation and recommends considering the generation 2 ratio rather than relying only on an absolute byte count. Pinned objects can contribute to fragmentation. Frequent loading and unloading of small assemblies, many COM references, and large transient objects are also documented as possible contributors to virtual-address-space fragmentation or difficulty allocating segments; treat these as leads to investigate, not automatic diagnoses.
Do these 3 things before closing this tab:
1Clear out junk files and repair common Windows errors2Fix the driver behind crashes, sound loss and screen glitches3Repair Windows errors before they cause bigger problemsUse generation-specific metrics when available
Starting with .NET 9, the documented metrics dotnet.gc.last_collection.heap.size and dotnet.gc.last_collection.heap.fragmentation.size report values tagged by heap generation, including gen0, gen1, gen2, LOH, and POH. Fragmentation bytes may be reused when an allocation fits in a gap. A special compacting GC can move live objects when they are not pinned. Confirm the deployed runtime’s metric availability and semantics before relying on dashboards or alert thresholds.
Rank #3
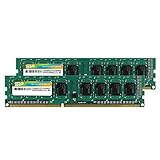
- Efficient performance: A lower voltage of 1.35 V is applied to reduce 20% power, enabling to effectively decrease hardware power consumption.
- System upgrade: With our high quality memory module, ideal for virtualization, cloud computing and multitasks handling, 100% factory-tested for stability, durability and compatibility.
- Durability Armed: 100% factory-tested to make sure the high stability, durability and compatibility.
- Compatibility is imperative: Compatible with major DDR3L / DDR3 motherboards.
- 【NOTE】The DDR3L UDIMM is backed by a lifetime warranty to promise complete services and technical support.
Interpret the large object heap carefully
In the cited .NET documentation, the default large object heap threshold is 85,000 bytes. This is a .NET-specific implementation detail, not a rule for other runtimes; check the deployed version and configuration. The runtime ordinarily avoids compacting the large object heap because moving large objects is costly. On-demand LOH compaction is documented for .NET Core and .NET Framework 4.5.1 and later, so confirm support and behavior for the version in use before considering it.
What to check in Go
Separate GC CPU cost from memory headroom
Go’s tracing collector uses GOGC to balance memory against CPU overhead. Increasing GOGC lowers GC CPU overhead but raises peak memory in proportion to the live heap; lowering it reduces peak memory at the cost of more GC CPU. The Go memory limit can trigger more frequent collections. The limit is soft, and setting it too close to the live set can lead to GC thrashing and poor progress.
Rank #4

- RYZEN 7 H 255 CPU - The Ryzen 7 H 255 is a chip from the Hawk Point family and is an upgraded version of the older Ryzen 7 8745H and has 8 cores (16 threads thanks to SMT support) that run at up to 4.9 GHz, together with the powerful Radeon 780M iGPU. Unlike Zen 3, Zen 4 offers AVX512 support along with other improvements such as larger caches/registers/buffers across the board.
- GAMING PC - The Radeon 780M (12 CUs / 768 shaders, up to 2,600 MHz) can drive multiple displays simultaneously with a resolution of up to 8K. Hardware encoding and hardware decoding of the most common video codecs (AV1, AVC, HEVC) is also no problem; playing the latest games on FSR settings without issues.
- WHY CHOOSE DDR5 5600MHz DUAL CHANNEL (2×16GB): With a 5600MHz clock—a 17% frequency uplift over 4800MHz—this kit delivers massive bandwidth gains that elevate real-world performance. Gamers enjoy higher minimum FPS and less stutter in open-world and sim titles for a smoother competitive experience. Video editors and 3D creators benefit from faster 4K/8K timeline scrubbing, quicker renders in DaVinci Resolve and Premiere, and swifter asset loading. For AI/LLM workloads, the superior throughput reduces I/O bottlenecks, cuts token generation latency, and accelerates model fine-tuning by keeping processing cores fed with data—so you wait less and create more.
- 32GB DDR5 RAM + 512GB SSD - The K12 mini computer is equipped with Dual 16GB (Total 32GB) SO-DIMM DDR5 5600MHz memory sticks. 512GB PCIE 4.0 SSD Drive with 3x M.2 2280 Expansion slots. Each slot capable of reading up to 8TB. (24TB MAX)
- QUAD SCREEN 4K DISPLAY SUPPORT - K12 Mini PC support 4-screen 4K/8K output via HDMI 2.1 (8K@60Hz), DisplayPort 1.4 (4K@60Hz), and USB Type-C Transfer speed (supporting PD3.0/DP1.4/DATA). Ideal for gaming, video editing, and multitasking, it provides expansive and crisp multi-display support.
Choose diagnostics that answer a specific question
runtime.ReadMemStatsreports heap-allocation and GC metrics.debug.ReadGCStatsreports GC pause statistics and percentiles.GODEBUG=gctrace=1prints collection events, including memory collected and pause length.- A heap dump captures allocated objects and runtime state, but suspends goroutines while it is written; weigh that disruption against its diagnostic value.
Virtual-memory figures such as VSS can mislead for Go because the runtime reserves address space. Favor RSS and similar physical-memory measures for process pressure, while keeping reserved address space, committed memory, resident memory, and live heap distinct in dashboards.
Free tools Windows power users keep installed
One-click scans. No signup required.
What to expect from Java 24 G1
Oracle’s Java 24 documentation describes G1 as a collector intended for multiprocessor systems and large amounts of memory, including heaps with significant fragmentation and variable allocation or promotion rates. G1 targets pause-time goals while maintaining throughput. Its concurrent work uses processor resources that would otherwise be available to the application, and throughput may be somewhat lower than with throughput collectors. Those are workload tradeoffs, not evidence that fragmentation alone explains a slowdown; assess pause goals, throughput, and memory behavior together.
Best Value

- Boosts System Performance: 32GB DDR5 RAM laptop memory kit (2x16GB) that operates at 5600MHz, 5200MHz, or 4800MHz to improve multitasking and system responsiveness for smoother performance
- Accelerated gaming performance: Every millisecond gained in fast-paced gameplay counts—power through heavy workloads and benefit from versatile downclocking and higher frame rates
- Optimized DDR5 compatibility: Best for 12th Gen Intel Core and AMD Ryzen 7000 Series processors — Intel XMP 3.0 and AMD EXPO also supported on the same RAM module
- Trusted Micron Quality: Backed by 42 years of memory expertise, this DDR5 RAM is rigorously tested at both component and module levels, ensuring top performance and reliability
- ECC Type = Non-ECC, Form Factor = SODIMM, Pin Count = 262-Pin, PC Speed = PC5-44800, Voltage = 1.1V, Rank And Configuration = 1Rx8
How the runtime guidance differs
| Runtime and scope | Useful evidence or behavior | Tradeoff to account for |
|---|---|---|
| .NET | Generation-specific heap size and fragmentation metrics are documented from .NET 9; pinning and LOH behavior are relevant diagnostic considerations. | Compaction is not part of every collection. LOH compaction is ordinarily avoided, though on-demand compaction is documented for supported versions. |
| Go | runtime.ReadMemStats, debug.ReadGCStats, GC traces, and heap dumps expose different allocation and collection details. |
GOGC and the soft memory limit affect the CPU–memory balance and collection frequency; a limit too close to the live set can cause thrashing. |
| Oracle Java 24 G1 | G1 is described for large heaps and pause-time goals, including heaps with significant fragmentation. | Concurrent work consumes processor resources, and throughput may be somewhat lower than with throughput collectors. |
These metrics and controls are not interchangeable. First establish which runtime and version is in production; then interpret the measurements using that runtime’s definitions rather than applying another runtime’s thresholds or tuning advice.
When to tune—and what success looks like
Tune only after measurements point to a plausible mechanism. A fragmentation concern should be supported by fragmentation data and allocation behavior, not inferred from process memory alone. A large post-collection live set points instead to reachable memory; frequent collections alongside rapid allocation point toward allocation pressure. In each case, evaluate changes under representative load and track the service outcomes that matter: memory use, latency, and throughput.
Quick Recap
Product prices and availability are accurate as of the date/time indicated and are subject to change. Any price and availability information displayed on Amazon at the time of purchase will apply.




