Enterprise data-centre customers can support AI growth while limiting emissions by using less avoidable compute, shifting flexible work to cleaner times and places, and demanding emissions data they can compare and scrutinise. Clean-energy contracts can help, but an annual matching claim does not prove that a facility is powered by carbon-free electricity in every hour. Customers can influence workload demand, timing, location, provider choice and procurement; the operator controls many facility and infrastructure decisions.
Why data-centre choices matter as AI use grows
The International Energy Agency (IEA) estimates that data centres used 415 terawatt-hours (TWh) of electricity in 2024—around 1.5% of global electricity consumption. Its 2025 Base Case projects use of around 945 TWh in 2030 and 1,200 TWh in 2035. These are scenario-based projections, not guaranteed outcomes; AI is a major driver alongside other digital services.
As an Amazon Associate I earn from qualifying purchases.
Demand and its effects are geographically concentrated. In 2024, the United States accounted for 45% of data-centre electricity consumption, China 25% and Europe 15%, according to the IEA. A global average can therefore hide pressure on a particular grid or community.
Do these 3 things before closing this tab:
1Fix the driver behind crashes, sound loss and screen glitches2Clear out junk files and repair common Windows errors3Scan for outdated or missing drivers - takes under a minute| Measure | Figure | What it represents |
|---|---|---|
| Global data-centre electricity use, 2024 | 415 TWh; around 1.5% of global electricity | IEA estimate for 2024, reported in 2025 |
| Global use, 2030 | Around 945 TWh | IEA 2025 Base Case projection |
| Global use, 2035 | Around 1,200 TWh | IEA 2025 Base Case projection |
| Share of global use, 2024 | United States 45%; China 25%; Europe 15% | IEA estimates for 2024, reported in 2025 |
The emissions path is also conditional. In the IEA’s 2025 Base Case, emissions from electricity generation for data centres peak at around 320 million tonnes of CO2 in 2030, then ease to around 300 million tonnes in 2035. Those are modeled estimates, not observed future results; electricity supply and demand scenarios affect them.
#1 Best Overall

- Sturdy:4u server rack is construct from cold rolled steel, with a weight capacity of 110lbs(50kg); Electrostatic powder coat prevents rust and corrosion,quality finish
- Direct use:Open and use, not having to assemble it.Network rack can be placed flat or mounted on the wall,also can be installed vertically under the table
- Design Features:maximum mounting depth of 14 in,cables can be fixed on the side panel;Open frame server rack achieves effortless inspection, replacement and assemble
- Installation:wall mount network rack is easy to install,with instructions or videos for reference;Equipped with multiple accessories, suitable for different needs
- Application:EIA/ECA-310-E Compliant;wall mounted 4u rack fits all 19" racks and cabinets to hold various IT, network, and AV equipment;wall mount rack available in 4U, 6U, and 8U to choose
Start with the compute you actually need
Find avoidable demand
Inventory AI and other data-centre workloads to identify idle resources, duplicated jobs, oversized infrastructure, low-value computation and data retained beyond its useful life. Then review model and application efficiency, utilization, storage-retention policies and job scheduling. The IEA estimates that servers account for around 60% of electricity demand in modern data centres, so efficient use of computing capacity matters as well as facility cooling. There is no universal customer-savings percentage established for these measures: results depend on the workload and implementation.
Ask for workload-relevant information
Where available, request energy and emissions information at the service, project or workload level rather than relying only on a company-wide sustainability figure. Ask how the provider attributes shared servers, networking, storage and cooling to your usage. Without an explained allocation method, a precise-looking customer total may still be difficult to compare with another provider’s estimate.
Move flexible work to a better time or place
For workloads that can move without harming service, compare candidate regions and operating times using both local grid conditions and provider-reported emissions data. Google Cloud’s methodology describes hourly location-based factors that reflect changes in grid mix and can inform timing or location choices. Its market-based reporting instead reflects clean-energy purchases and uses annual factors. Those views answer different questions: what the grid serving a location emits, and how procurement instruments are treated in accounting.
The Tool Desk
Outbyte Driver Updater FREEFix the driver behind crashes, sound loss and screen glitchesFind Drivers →Outbyte PC Repair FREERepair Windows errors before they cause bigger problemsFix Now →Rank #2

- WIDE VOLTAGE COMPATIBILITY – Operates on a 100–240VAC input range and features an electronically commutated (AC/EC) motor that runs on AC power while performing like an efficient DC motor.
- QUIET AND ENERGY-EFFICIENT – Provides strong airflow at just 42.3 dB-A noise level and 99.42 CFM, using smart onboard electronics to optimize energy use and reduce noise in sensitive environments.
- RELIABLE THERMAL MANAGEMENT – Helps prevent overheating and supports system stability in server rooms, A/V closets, studios, and data centers with consistent top-mounted cooling.
- EASY INSTALLATION – Ships fully assembled and ready to install with wire leads; compatible with standard top-mount fan panels for fast setup and minimal downtime.
- BUILT FOR DEMANDING ENVIRONMENTS – Ideal for SOHO, IT, and telecom applications where quiet operation and dependable airflow are critical to equipment longevity and uptime.
There is no universally best region. A lower reported emissions figure must be considered alongside latency, resilience, cost, data-residency rules, water needs and local grid constraints. Treat demand response or shifting non-urgent computation as options to discuss with the provider, not capabilities every workload or facility necessarily offers. Google says it uses demand response and flexibility when possible.
Compare emissions reports on the same basis
Ask providers to explain the accounting boundary and data behind a customer-level figure before comparing totals. In particular, distinguish location-based from market-based reporting; neither alone answers every question about physical electricity supply or a customer’s complete footprint.
| What to compare | Question for the provider | Why it matters |
|---|---|---|
| Reporting basis | Do you provide both location-based and market-based emissions, and what factors produce each figure? | The approaches reflect different views of grid electricity and procurement claims. |
| Time and geography | Are data and emissions factors specific to a region and an hour, or are they annual and broader? | Annual or wide-area averages can conceal when and where electricity is consumed. |
| Boundaries | Which scopes and lifecycle stages are included or excluded? | Figures with different boundaries are not like-for-like, even if both are labelled customer emissions. |
| Allocation | How are shared infrastructure emissions assigned to my account, project, service or workload? | Allocation choices affect the customer’s reported share of a shared facility’s impact. |
| Assurance and review | Is the customer-level data independently assured, or has only the calculation method been reviewed? | Review of a method is not the same as independent verification of each customer’s data. |
| Updates | How often is the information updated, and how are methodology changes reflected in past periods? | Consistent comparisons need clear dates and treatment of revisions. |
For example, Google Cloud publishes both location-based and market-based customer reporting, but its methodology says customer-specific estimates have not been third-party verified or assured. The company describes a review of its allocation methodology; buyers should distinguish that from assurance of the reported customer data.
Rank #3

- Save valuable floor space: 12U wall mount server cabinet Dimensions: 24.25" H x21.65" W x17.72" D. MAXIMUM MOUNTING DEPTH is 14.2".
- Keep critical network equipment secure: glass door and side panels are lockable to prevent unauthorized access; Front door can be installed on either side of the front of the cabinet to satisfy your door swing orientation preference
- Easy equipment configuration: Fully adjustable mounting rails and numbered U positions, with square holes for easy equipment mounting with top and bottom punchout panels for easy cable access
- Durability: Made of high quality cold rolled steel holds up to 110lb (50kg) (Easy Assembly Required)
- PCI & HIPPA and EIA/ECA-310-E compliant
Use clean-energy procurement carefully
Where your organisation has direct influence over energy procurement, options include long-term power-purchase agreements (PPAs), utility green tariffs or supply arrangements, energy-attribute instruments, on-site generation, storage and pooled demand with other buyers. Assess whether a purchase supports additional clean generation, whether that generation can serve the relevant market, how long the arrangement lasts, whether it matches consumption hourly or annually, and how it interacts with local grid constraints.
Outdated Drivers Are Slowing You Down
One free scan finds every outdated or missing driver and matches the right update for your exact hardware.Free scan · exact hardware matchWindows Errors? Fix Them Before They Spread
Repair common Windows errors and clear accumulated junk for a smoother, more stable PC - no reinstall needed.Free scan · no reinstallA renewable-energy contract or annual matching claim is not proof that every hour of a particular data-centre load is physically supplied by carbon-free generation on its local grid. Treat procurement as one contribution to a broader plan, alongside reducing demand and improving workload timing and reporting.
Company examples illustrate the difference between procurement activity and an hour-by-hour outcome. Microsoft reported in 2025 that it had contracted 34 gigawatts (GW) of new renewable energy across 24 countries. That company-reported figure does not mean every hour or location is matched. Google describes using PPAs, utility and developer arrangements, supply contracts and targeted investments; its initiative with Microsoft and Nucor illustrates pooled demand for emerging clean technologies. These approaches are examples, not guaranteed results for every buyer.
Rank #4

- 12U wall mount cabinet
- [Heavy Duty]: MT-VIKI wall mount cabinet is made from SPCC cold-rolled steel with maximum loading capacity of 132lbs(60kgs) for equipments, 0.8mm thick steel, more sturdy.
- [Security and Protection]: Locking front door and side panel prevent unauthorized access to equipments.
- [Easy Access]: Quick open side panel for easy maintenance.
- Package: 12U rack cabinet *1, 12'' depth rack shelf*1.
Include the facility, water and community in provider decisions
Ask providers about operational efficiency, cooling, flexible-load participation, plans for new local generation and transmission, and how they manage effects on nearby communities. These are largely operator decisions, but enterprise demand and procurement requirements can influence what operators build and disclose.
Facility type matters: the IEA estimates that cooling accounts for around 7% of electricity use in efficient hyperscale data centres, compared with over 30% in less-efficient enterprise centres. Those figures describe different facility conditions, not a universal cooling share. Google reports a fleet-wide average power usage effectiveness (PUE) of 1.09 for 2025. That is the company’s own figure, not an industry benchmark; PUE is a facility-efficiency measure, not a direct measure of the carbon intensity of its electricity.
Design choices also involve water and embodied carbon, not only operating electricity. Microsoft reported in 2025 that direct-to-chip cooling saves over 125 million litres of water per facility each year, and that hybrid timber-steel construction can reduce embodied carbon by up to 65% versus traditional concrete models. These are company-reported design claims, not universal results. Ask what applies to the specific facility and what baseline or boundary underlies a claim.
Best Value
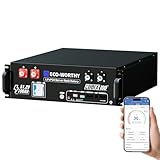
- UL9540 | UL1973 | CEC LISTED - Completed comprehensive testing by Intertek and has officially earned three key North American safety certifications.And has met the standards set by the California Energy Commission.The outstanding performance in design, electrical safety, and thermal runaway management,providing users with greater quality assurance.
- Home Energy Storage System: Built with high-quality Grade A LiFePO4 cells for reliable power, exceptional cycle life, and consistent safety. Designed for multiple uses: emergency backup during outages, daily home backup, and with solar panels, continuous power for off-grid cabins.
- Closed-Loop Communication Battery: ECO-WORTHY 48V (51.2V) server rack battery features integrated CAN/RS485 interfaces and multiple communication protocols, enabling communication with leading integrated solar inverters for more intelligent system operation. Built-in Bluetooth and WiFi functionality allow you to easily monitor battery status via ECO-WORTHY APP.
- Space-Saving Rack Design: This 48V 100AH lithium battery is perfectly compatible with server racks and supports vertical mounting for maximum space efficiency. By paralleling up to 32 units (up to 163.8kWh), you can expand power capacity to meet any need.
- Complete Plug-and-Play Kit: We include every accessory you need: parallel cables, communication cables, grounding wires, protective terminal covers, screws, and a user manual. Unbox, install, and start enjoying clean power—it's that easy.
Interpret provider progress without mistaking it for a guarantee
Google reported that its data-centre electricity demand rose 27% in 2024 while its energy-related emissions fell 12%; its hourly carbon-free energy share rose from 64% to 66%. These are company-reported results for Google, not a sector-wide measure or a promise about the electricity associated with any one customer’s workload. They show why buyers should examine demand, emissions and hourly clean-energy coverage together rather than treating any single metric as the whole story.
Make comparisons only after aligning region, workload, reporting period, accounting boundary and assurance status. Then weigh the carbon information against reliability, latency, cost, water and local impacts; a provider or region cannot be declared the better choice without that context.
Quick Recap
Product prices and availability are accurate as of the date/time indicated and are subject to change. Any price and availability information displayed on Amazon at the time of purchase will apply.
What’s actually slowing this PC down?
Pick the symptom - the matching free tool is one click away.




