Archaeologists map underwater ruins in stages: sonar searches and measures the seabed, then divers or remotely operated vehicles (ROVs) photograph selected features for detailed mosaics and 3D models. Navigation, reference points, field notes and archiving connect those images and acoustic measurements to archaeological context and real-world locations.
Why underwater archaeology uses more than one mapping method
No single instrument produces every kind of evidence an underwater site needs. Sonar can survey areas that are difficult or unsafe for divers and reveal seabed forms over broad coverage. Photogrammetry uses visible-light images to document selected places in much finer visual detail. The methods complement one another, but their outputs are different: an acoustic image, a bathymetric surface and a photograph-derived 3D model should not be treated as interchangeable maps.
As an Amazon Associate I earn from qualifying purchases.
The survey question determines the tools. A team might be looking for raised features across a large area, measuring the shape of the seabed around a known wreck, recording the arrangement of timbers and artifacts, or investigating a feature covered by sediment. Water depth, visibility, terrain, currents, safety and the desired level of detail all affect the plan. The Naval History and Heritage Command (NHHC) describes side-scan sonar, multibeam echosounders, sub-bottom profilers, autonomous underwater vehicles (AUVs) and ROVs as tools suited to different parts of that work, rather than substitutes for one another (NHHC fieldwork guidance).
What each instrument can reveal
| Method | What it records | Useful question |
|---|---|---|
| Side-scan sonar | Plan-view acoustic imagery of the seabed, including shadows and returns from features with relief. | Where are objects or structures that stand out from the surrounding bottom? |
| Multibeam echosounder | Bathymetric measurements across a swath beneath the survey platform. | What is the shape and depth of the seabed, and how does a site sit within it? |
| Sub-bottom profiler | Acoustic information about features beneath the sediment surface. | Could an anomaly or deposit be buried? |
| Photogrammetry | Overlapping visible-light photographs processed into products such as a photomosaic or textured 3D model. | What does a selected feature look like in detailed, measurable visual record? |
These descriptions are functional, not a universal ranking of resolution or accuracy. The right choice depends on the target, the survey platform, site conditions and how the results will be used. Side-scan sonar is particularly useful for searching for relief-bearing features; multibeam adds a different product—bathymetry—and can complement side-scan imagery or provide site-specific data. If the target may lie under sediment, a sub-bottom profiler addresses a question that ordinary visible-light imagery cannot.
#1 Best Overall
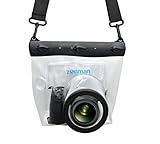
- Universal Compatibility: Designed for a wide range of DSLR, this Zonman waterproof case or bag fits most models of Canon, Nikon, Sony camera bodies. Perfect for cameras with a lens length up to 13cm or 5.12" and a diameter of 8cm or 3.15" , ensuring a secure fit for your valuable equipment. fit for cameras with lens not longer than 5.12'' like ::Canon Rebel T Series 80D 90D 55D 650D 750D 800D 6DMarkII 7DMarkII Nikon D90 D500 D610 D810 D850 D D3500 D5100 D5200 D5300 D5500 D5600 D7500 etc, or similar size.
- Easy Camera Function Access: Though fully enclosed for maximum protection, our housing case or bag features strategically placed finger holes, allowing effortless access to crucial camera functions like shutter release and zoom and focusing. Capture stunning underwater and wet-weather shots with ease.
- Ultimate Protection: Whether you're caught in rain, snow, or a sandy beach, our underwater housing case or bag shields your camera from the elements. Its complete seal locks out water, moisture, dust, mud, and sand, offering unparalleled protection in any environment.
- Dive Deep into Adventure: With an underwater depth capacity of approximately 5 meters or 16 feet, this case is ideal for a variety of water sports including diving, rafting, surfing, snorkeling, and swimming. Capture stunning underwater shots without worrying about water damage.
- Versatile Outdoor Use: Not just for water-based activities, this housing is also perfect for fishing, boating, and other outdoor pursuits where your camera might be exposed to harsh conditions. Enjoy peace of mind knowing your gear is safe from the elements.
How archaeologists plan the survey
1. Define the archaeological question
Before choosing equipment, the team decides whether it needs a broad search, seabed depth data, a detailed record of a known site or evidence of buried material. A towed side-scan sonar may suit a broad search for objects that rise above the bottom. A multibeam echosounder can map seabed shape across the vessel’s path. An AUV can be selected for large swaths or high-resolution surveys, while an ROV can reach deep or hazardous environments and collect imagery where sending a diver would be unsuitable. These are examples of task-specific choices, not a fixed sequence every project must follow.
2. Design the route and sensor setup
Coverage depends on decisions such as sonar frequency, distance between survey lines, sensor altitude and overlap between image passes. NHHC guidance describes typical side-scan frequencies of 100–400 kHz for broader, lower-resolution surveys and 600–1600 kHz for narrower, higher-resolution surveys. It also discusses 300–500 kHz for cultural-resource survey at a stated line spacing. These are operational guidance values on the NHHC page, whose publication year is not shown; they are not universal specifications, guaranteed resolutions or settings that can be transferred unchanged to every instrument and site.
Line spacing and altitude affect what area is covered and how clearly a feature can be recorded. A configuration that favors broad coverage may not offer the same detail as a narrower survey. The team has to balance search area, required detail, water depth, range and conditions rather than assume that one frequency or route is always best. NHHC discusses these choices as part of survey planning in its archaeological fieldwork guidelines.
Recommended Free Tools
3. Establish position and keep a field record
A map is useful only if its measurements can be placed in space. NHHC recommends navigation that continuously determines the vessel and sensor position, calibration, and digital logging of position fixes. When an instrument is towed behind a vessel, recording sensor position matters: the sensor is not necessarily at the vessel’s location. Position information, calibration and survey logs help relate the collected data to the site rather than leaving a compelling image without a dependable geographic reference.
Rank #2

- For Tough TG-6 Digital Camera
- Retains Access to All Camera Controls
- Supports Optional Lens Accessories
- Depth Rating: 147'
- Can Accommodate Two External Flashes
The crew also records survey procedures and major events that could affect interpretation. Environmental notes may include bottom type, salinity, currents, turbidity and marine communities where relevant. Such conditions can help explain why a sensor missed, distorted or obscured a feature. A patch of poor returns or missing imagery should be interpreted in light of what happened during collection, not automatically as evidence that no archaeological material is present.
How sonar turns a search area into a map
Side-scan sonar: acoustic images for searching
Side-scan sonar sends sound outward and records echoes from the seabed. The resulting planimetric acoustic image can show differences in the strength of returns; objects or structures that rise above the bottom may also cast acoustic shadows. Those patterns help archaeologists identify and compare anomalies across a survey area. The image is not a photograph: it represents how sound interacted with the seabed, so its appearance depends on the target, bottom conditions, sensor geometry and settings.
Side-scan can help narrow a broad search to locations that merit closer investigation. It does not by itself establish the identity, age or archaeological meaning of every anomaly. Interpretation may require further acoustic coverage, bathymetric context, visual inspection or other evidence. The purpose of a survey is not simply to produce an interesting image; it is to make a defensible record of where the feature is, what was observed and how the observation was collected.
Quick wins for a faster PC:
Clear out junk files and repair common Windows errorsFree Scan →Fix the driver behind crashes, sound loss and screen glitchesFind Drivers →Repair Windows errors before they cause bigger problemsFix Now →Multibeam: seabed shape and depth
A multibeam echosounder gathers bathymetric data across a swath below the survey platform. The result can represent the depth and shape of the bottom, giving site features a topographic setting. That is different from side-scan’s acoustic image: multibeam measurements describe seabed form and depth, while side-scan helps show acoustic contrasts and shadows. Using both may answer more than either alone, but neither product should be relabeled as the other.
Rank #3

- Floating】:Our Dving Case Bag makes your camera to avoid dropping your valuables in the water.100% completely sealed, up to 20 meters deep.
- 【Powerful Function】:, dust, mud, sand, snow, grease, can the camera. your camera , for beach, pools, fishing, swimming, boating, kayaking, snorkeling,etc.
- 【Easy to Use】The camera can be operated directly in the case.
- 【Multi-Device Support】Our Dving Case Bag universal for most DSLRs such as for , .
- 【Quality Service】:If you have any questions about this product, you can us at any time. We have a professional customer service team and will provide you with the best quality service. We will try our best to solve your problem in time, please rest assured to buy.
Buried features and platform access
A feature hidden beneath sediment presents a different problem from a visible structure on the seabed. NHHC identifies sub-bottom profilers as tools for investigating buried anomalies. Platform choice matters too: an AUV may collect data over a large or high-resolution survey area, while an ROV provides access for observation in deep or hazardous locations. The instrument and vehicle address different constraints; the existence of one does not eliminate the need to plan for navigation, safe access and archaeological documentation.
How photographs become photomosaics and 3D models
Collect overlapping views
Photogrammetry begins with a planned set of overlapping photographs, not a single attractive image. A diver or ROV travels along routes that record the site from multiple distances and angles. A video can also be converted into still frames. NOAA Ocean Exploration defines photogrammetry as “a method of approximating a three-dimensional (3D) structure using two dimensional images” (NOAA Ocean Exploration, published June 22, 2020; updated October 29, 2024).
For underwater photomosaics, NHHC gives guidance of at least 50% overlap in both directions and a typical image-collection altitude of 2.5–5 m depending on water clarity. These are recommendations from the NHHC page, whose publication year is not shown, rather than guarantees that every image set will produce a complete or accurate model. The needed overlap and working distance depend on visibility, site geometry, camera movement and the details the project must document.
Water clarity constrains what a camera can record. If visibility is limited, the useful distance between camera and subject may shrink, and a route that works in clear water may not give adequate image detail in murkier conditions. Capturing many photographs does not solve every problem: images need enough shared visible features to be aligned, and the survey must cover the intended surfaces from suitable angles. NOAA describes the need to record a site from multiple distances and viewpoints in its photogrammetry overview.
Rank #4

- Compatible with small DSLR/SLR cameras
- 100% waterproof protection, guaranteed for water depths up to 5 meters
- UV polycarbonate coated optical lens (diameter 85mm/3.3") allows you to take clear pictures
- Fits zoom lenses up to 9.5cm (3.7") in length
- Easy button control with the finger sleeve
Process images into spatial products
Processing software identifies common landmarks across overlapping photographs and estimates how the camera views relate to one another. It aligns and adjusts the images to create a point cloud, a three-dimensional set of sampled positions. The point cloud can be developed into a surface mesh and textured with the photographs. Depending on the project and processing, outputs may include a photomosaic, an orthographic view and a textured 3D model. NOAA outlines this image-to-model workflow and its use for digital preservation.
A photomosaic arranges image information into a continuous view of a site; an orthographic view presents a flattened perspective useful for measuring and comparing features; a 3D model preserves shape and surface appearance in three dimensions. These products can support later examination without requiring every researcher to return to the site, but their usefulness depends on good image collection and processing records. A visually detailed model is not automatically a geographically controlled survey map.
Independent reader supportYour contribution helps us test, update, and keep practical guides available for everyone.How a 3D model gets a real-world position and scale
Photogrammetry can reconstruct the relative geometry of a scene from images, but image geometry alone does not say where the scene is on Earth or guarantee its scale. Reference points visible in photographs can bind image coordinates to real-world coordinates. The French Ministry of Culture’s account of underwater 3D modelling explains the role of reference points in producing scaled, geographically positioned reconstruction (French Ministry of Culture).
What’s actually slowing this PC down?
Pick the symptom - the matching free tool is one click away.
In practice, archaeological teams need to record control information alongside image capture and retain navigation data that locates the survey. If reference points are absent or poorly recorded, a model may still show a feature’s visual form while its dependable geographic position or scale remains unestablished. This distinction matters when comparing models, locating finds, relating a feature to a larger site plan or revisiting the location later. NHHC likewise emphasizes navigation and field documentation as part of archaeological survey work.
Best Value

- 【DESIGNED FOR】Go Pro Hero 13 Black/Hero 12 Black/Hero 11 Black/Hero 10 Black/Hero 9 Black.
- 【60M/196FT Waterproof】This waterproof housing case with upgraded waterproof sealing ring and tight buckle that help avoid water leakage effectively.You can use your camera to record underwater activity deep to 196FT/60 Meters without worrying about leaks,and it also won't damage the shooting effect, clear and vivid.
- 【STAINLESS STEEL MATERIAL】The hardware is made of stainless steel to prevent rusting after being used in the sea. You can dive into the sea do not have to worry about rust.
- 【LARGE FLAT GLASS LENS】Delivers maximum image sharpness above and below water.
- 【Excellent PMMA material&High Light Transmission】Waterproof up to 60m/196FT, ideal for diving, surfing, snorkeling and other water sports activities.Toughened glass in front of the camera, you can make your camera better light transmittance, LIGHT TRANSMISSION RATE OF 98.99%, Shoot more real, more beautiful pictures.
What makes the resulting map an archaeological record
A map records where observations were made; archaeology also depends on context. NHHC advises recording provenience on the site map, documenting context such as structures and layers, and completing documentation before disturbance. Moving an object or altering a site before its relationships have been recorded can remove information that a model alone cannot restore. A 3D record helps preserve visible form, but it does not replace observations about how features relate to one another or what was changed during fieldwork.
The archive should preserve the path from collection to interpretation, not only a finished rendering. The Archaeology Data Service’s 2024 UK-oriented Marine Survey Data guide describes possible archive contents including 3D models, GIS mapping, imagery, video, geotechnical and dating data, instrument logs, ecological surveys and reports. For a particular project, the useful record may include raw or processed data, metadata, navigation and positioning, calibration details, image sets, survey logs and interpretive products. Metadata explains how an output was made; logs preserve events and decisions that may affect how it should be read.
Archiving these materials makes a survey more reusable. A later researcher can distinguish collected observations from interpreted features, understand the conditions under which data were gathered, and revisit the assumptions behind a map or model. A polished visualization without its supporting data and documentation can be difficult to verify or compare, even when it looks convincing.
Quick Recap
Common interpretation mistakes to avoid
- Calling every sonar output a map of the same kind. Side-scan acoustic imagery and multibeam bathymetry represent different evidence and should be identified accurately.
- Treating an anomaly as an identified ruin. Sonar can reveal a feature worth investigating; archaeological interpretation requires context and may need additional evidence.
- Assuming a detailed model is georeferenced. Image detail does not establish real-world coordinates or scale without positioning and reference control.
- Applying a frequency or overlap value universally. NHHC’s values are operational guidance examples; survey design must respond to the objective, instrument and conditions.
- Equating missing data with an empty seabed. Visibility, terrain, sensor geometry, currents and survey events can affect detection and recording; logs and environmental observations help assess those limits.
- Keeping only the finished model. Images, positioning, metadata, logs, GIS products and interpretation preserve how the result was created and what it can support.
Product prices and availability are accurate as of the date/time indicated and are subject to change. Any price and availability information displayed on Amazon at the time of purchase will apply.




