Do these 3 things before closing this tab:
1Repair Windows errors before they cause bigger problems2Fix the driver behind crashes, sound loss and screen glitches3Clear out junk files and repair common Windows errorsCPU throttling is Windows and your hardware working within limits. When your CPU runs into thermal, power, or firmware constraints, it reduces clocks to prevent damage and keep operation stable.
Windows 10 doesn’t always label throttling clearly, so you have to confirm it using frequency behavior, power/thermal signals, and the right performance counters. This guide shows you exactly how to check CPU throttling with built-in tools first, then with Intel and AMD utilities when you need precision.
As an Amazon Associate I earn from qualifying purchases.
What CPU throttling means on Windows 10 (and why it happens)
Throttling is a deliberate performance cap. Common causes include overheating, hitting a power budget (especially on laptops), VRM/current limits, or conservative firmware behavior in BIOS and power management.
On Windows 10, you’ll usually see it indirectly: clock speeds drop during sustained load, performance flattens, and—if you can read them—temperatures or power draw reach a ceiling.
#1 Best Overall
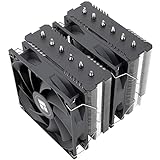
- [Brand Overview] Thermalright is a Taiwan brand with more than 20 years of development. It has a certain popularity in the domestic and foreign markets and has a pivotal influence in the player market. We have been focusing on the research and development of computer accessories. R & D product lines include: CPU air-cooled radiator, case fan, thermal silicone pad, thermal silicone grease, CPU fan controller, anti falling off mounting bracket, support mounting bracket and other commodities
- [Product specification] Thermalright PA120 SE; CPU Cooler dimensions: 125(L)x135(W)x155(H)mm (4.92x5.31x6.1 inch); heat sink material: aluminum, CPU cooler is equipped with metal fasteners of Intel & AMD platform to achieve better installation, double tower cooling is stronger((Note:Please check your case and motherboard for compatibility with this size cooler.)
- 【2 PWM Fans】TL-C12C; Standard size PWM fan:120x120x25mm (4.72x4.72x0.98 inches); fan speed (RPM):1550rpm±10%; power port: 4pin; Voltage:12V; Air flow:66.17CFM(MAX); Noise Level≤25.6dB(A), leave room for memory-chip(RAM), so that installation of ice cooler cpu is unrestricted
- 【AGHP technique】6×6mm heat pipes apply AGHP technique, Solve the Inverse gravity effect caused by vertical / horizontal orientation, 6 pure copper sintered heat pipes & PWM fan & Pure copper base&Full electroplating reflow welding process, When CPU cooler works, match with pwm fans, aim to extreme CPU cooling performance
- 【Compatibility】The CPU cooler Socket supports: Intel:115X/1200/1700/17XX AMD:AM4;AM5; For different CPU socket platforms, corresponding mounting plate or fastener parts are provided(Note: Toinstall the AMD platform, you need to use the original motherboard's built-in backplanefor installation, which is not included with this product)
Prerequisites and what you need before you test
- Windows 10 version: this guide targets Windows 10 (1709+ works best for modern tools). You can check via Settings > System > About.
- Admin access: needed for some Performance Monitor counters and data collection.
- Time window: decide how long you’ll test (commonly 10–30 minutes for thermal throttling, 5–10 minutes for power-limit throttling).
- A repeatable workload: use a stable stress test (CPU-only) or a consistent real app workflow.
- Cooling and environment: throttling is sensitive to room temperature and cooling health. Don’t compare apples to oranges—use the same conditions.
Fastest ways to check CPU throttling (no extra software)
If you just need a trustworthy signal, start with Task Manager and (optionally) Resource Monitor. For stronger evidence, use Performance Monitor (perfmon) counters.
Task Manager (Processes + Performance)
Task Manager won’t spell out “thermal throttling” by name, but it’s great for spotting frequency drops while load stays high.
- Right-click the taskbar > Task Manager.
- Go to the Performance tab.
- Select CPU.
- Enable the chart options you can: look for Speed (frequency), and keep the window visible.
- Go to the Processes tab, right-click a column header, and add columns if available (common ones include CPU, Speed, Power usage).
- Run a sustained CPU workload for 10+ minutes.
- Watch for this pattern: CPU utilization stays high (often >70%) while the “Speed” value drops and stays lower.
What it means: sustained lower frequency under load is the classic throttling signature. If “Speed” never changes much, you may not be seeing the right data source or you might be CPU-idle rather than CPU-stressed.
Resource Monitor (clocks vs activity clues)
Resource Monitor is older than Task Manager, but it can still help you verify that the system is actually doing CPU work and not waiting on something else.
- Press Win + R, type resmon, press Enter.
- Go to the CPU tab.
- Start your workload.
- Check Total and per-process activity to confirm CPU demand persists.
Limit: Resource Monitor doesn’t provide the same high-resolution clock telemetry as perf counters or vendor tools. Use it to rule out “idle due to waiting.”
Performance Monitor (perfmon) with key counters
Performance Monitor can give you stronger evidence by correlating utilization and frequency, and it can log data for later analysis.
- Press Win + R, type perfmon, press Enter.
- Expand Monitoring Tools > Performance Monitor.
- Click the green + Add button.
- Add these counters where available (names can vary slightly):
- Processor > % Processor Time (use _Total or per-core).
- Processor > Processor Frequency.
- Thermal Zone Information or vendor-specific providers (if present) for temperature.
- Power or Power Meter counters (if present) for power draw.
- Click OK.
- Let the graphs run while you apply sustained CPU load.
- To record a time window: use Data Collector Sets (search in perfmon) or log from Performance Monitor if your build supports it.
What you want: a visible drop in Processor Frequency that coincides with sustained high % Processor Time. That’s a strong throttling indicator even without temperature counters.
Detect throttling states more accurately with vendor tools
For true throttling confirmation, vendor tools can expose power/thermal throttling flags, package power limits, and per-core behavior that Windows hides.
Intel platforms: Intel Power Gadget and Intel XTU
Intel Power Gadget is widely used for real-time Intel package power and clock behavior on supported systems. Intel XTU (Extreme Tuning Utility) can also show limits and throttling-related metrics depending on CPU generation.
Rank #2

- CONTACT FRAME FOR INTEL LGA1851 | LGA1700: Optimized contact pressure distribution for longer CPU life and better heat dissipation
- ARCTIC's P12 PRO FAN: More power at any speed - more powerful and quieter than the P12, especially at low speeds. Higher maximum speed for optimal cooling performance under high load
- NATIVE OFFSET MOUNTING FOR INTEL AND AMD: Shifting the cold plate center towards the CPU hotspot ensures more efficient heat transfer
- INTEGRATED VRM FAN: PWM-controlled fan that lowers the temperature of the voltage converters and thus ensures reliable performance
- INTEGRATED CABLE MANAGEMENT: The PWM cables of the radiator fans are integrated in the sheathing of the hoses so that only a single visible cable is connected to the motherboard
- Install Intel Power Gadget (requires Intel platform support).
- Launch it and confirm you’re seeing CPU frequency and power readouts.
- Start your sustained CPU workload.
- Watch for the frequency curve flattening while package power approaches its limit.
- If you have Intel XTU, open its monitoring view and look for indicators related to power/thermal limits.
Practical signal: When power approaches a limit (PL1/PL2 behavior varies by system) and frequency can’t climb further during sustained load, that’s throttling-by-power rather than a simple load change.
AMD platforms: AMD Ryzen Master
Ryzen Master provides per-CPU telemetry on many desktop and laptop configurations and makes it easier to see when boost behavior changes.
Free tools Windows power users keep installed
One-click scans. No signup required.
- Install AMD Ryzen Master.
- Open Monitoring or the main dashboard.
- Run sustained CPU load and watch CPU clocks, package power, and temperature.
- Look for sustained reductions in boost clocks once temperatures or power hit caps.
Practical signal: boost clocks that drop and stay down during long runs strongly indicate thermal or power-limited operation.
Laptop-specific utilities (Dell/HP/Lenovo) and BIOS flags
Many OEMs add their own performance modes (Balanced, Performance, Quiet) and thermal policies. These often govern whether throttling is aggressive under sustained load.
- Check if your laptop includes an OEM app: for example, Dell Power Manager, HP Command Center, or Lenovo Vantage.
- Set the performance mode to Performance (and disable “quiet/eco” modes) for testing.
- In BIOS/UEFI, look for power/thermal profiles and whether undervolting/PL limits are locked.
Gotcha: Some systems throttle earlier on battery to protect thermals and power delivery. Always test on AC power unless you specifically want battery behavior.
Understand the most common throttling triggers on Windows 10
Thermal throttling (temperature, power limits)
Thermal throttling typically shows up as sustained frequency reductions once the CPU hits a temperature threshold. The exact temperature depends on CPU model, BIOS tuning, and cooling.
Even if you can’t see temperatures in Windows, you can still confirm throttling by the frequency drop pattern under constant CPU load.
Power throttling (battery/power plan)
Windows power plans can reduce maximum processor state, capping performance. On laptops, battery mode is a frequent culprit.
Windows 10 also respects modern power policies like processor power management settings that impact boost behavior.
Rank #3
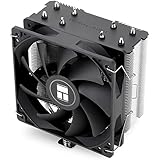
- [Brand Overview] Thermalright is a Taiwan brand with more than 20 years of development. It has a certain popularity in the domestic and foreign markets and has a pivotal influence in the player market. We have been focusing on the research and development of computer accessories. R & D product lines include: CPU air-cooled radiator, case fan, thermal silicone pad, thermal silicone grease, CPU fan controller, anti falling off mounting bracket, support mounting bracket and other commodities
- [Product specification]AX120R SE; CPU Cooler dimensions: 125(L)x71(W)x148(H)mm (4.92x2.8x 5.83 inch); Product weight:0.645kg(1.42lb); heat sink material: aluminum, CPU cooler is equipped with metal fasteners of Intel & AMD platform to achieve better installation
- 【PWM Fans】TL-C12C; Standard size PWM fan:120x120x25mm (4.72x4.72x0.98 inches); fan speed (RPM):1550rpm±10%; power port: 4pin; Voltage:12V; Air flow:66.17CFM(MAX); Noise Level≤25.6dB(A), the fan pairs efficient cool with low-noise-level, providing you an environment with both efficient cool and true quietness
- 【AGHP technique】4×6mm heat pipes apply AGHP technique, Solve the Inverse gravity effect caused by vertical / horizontal orientation. Up to 20000 hours of industrial service life, S-FDB bearings ensure long service life of air-cooler radiators. UL class a safety insulation low-grade, industrial strength PBT + PC material to create high-quality products for you. The height is 148mm, Suitable for medium-sized computer case
- 【Compatibility】The CPU cooler Socket supports: Intel:1150/1151/1155/1156/1200/1700/17XX/1851,AMD:AM4 /AM5; For different CPU socket platforms, corresponding mounting plate or fastener parts are provided
Current/VRM throttling (desktop boards, sustained load)
Some systems throttle due to motherboard VRM temperature/current limits. This can look identical to CPU throttling in broad charts: clocks drop while utilization stays high.
The Tool Desk
Outbyte Driver Updater FREEScan for outdated or missing drivers - takes under a minuteDriver Scan →Outbyte PC Repair FREERepair Windows errors before they cause bigger problemsFix Now →If you have motherboard sensors or OEM utilities, verify whether VRM temperatures are reaching their thresholds.
Firmware/BIOS and Windows power policy
Firmware can impose power limits (for example, long-term power budgets) that cause the CPU to boost briefly and then settle lower for sustained workloads.
This is normal behavior for some CPUs, but if it seems too severe, it can be influenced by BIOS settings, Windows power policies, or outdated firmware.
How to run a clean throttling test (repeatable procedure)
Most “throttling” confusion comes from unstable workloads, background tasks, or different power states. Use a simple repeatable workflow and record what you see.
What’s actually slowing this PC down?
Pick the symptom - the matching free tool is one click away.
Step 1: Pick the right power plan
- Open Control Panel > Hardware and Sound > Power Options.
- Select a plan like High performance or Balanced (then tune settings if needed).
- For laptops, plug into AC power.
Step 2: Baseline without load
- Close heavy apps.
- Let the system idle for 2–5 minutes.
- In Task Manager > Performance > CPU, note the typical Speed value range.
Step 3: Apply controlled load
Use a CPU-heavy workload that you can repeat. Examples include CPU stress tools or CPU-intensive benchmarks. Aim for a sustained load for at least 10 minutes.
Step 4: Record clocks, utilization, and temperatures
- Open Task Manager > Performance > CPU and keep it visible.
- Optionally, open perfmon and start counter graphs for % Processor Time and Processor Frequency.
- Record observations at roughly 1-minute intervals for the first 5 minutes and again near the 10–20 minute mark.
Step 5: Compare pre- and post-throttle windows
If the CPU boosts at the start and then its frequency drops and stays lower while utilization remains high, that’s throttling. If clocks don’t change, either you’re not hitting limits or your telemetry doesn’t reflect real limits.
Interpretation: what to look for to confirm throttling
Clock speed drop while CPU utilization stays high
This is the most reliable visual pattern when you only have Task Manager. Sustained high utilization with a persistent lower Speed indicates throttling or a power/firmware cap.
Runaway temperatures with sustained frequency cap
If you can view temperatures (vendor tools or sensor software), you typically see temperature climb to a threshold, then frequency flatten. The CPU keeps working, but it can’t raise frequency further.
Windows Errors? Fix Them Before They Spread
Repair common Windows errors and clear accumulated junk for a smoother, more stable PC - no reinstall needed.Free scan · no reinstallOutdated Drivers Are Slowing You Down
One free scan finds every outdated or missing driver and matches the right update for your exact hardware.Free scan · exact hardware matchRank #4
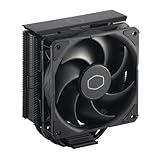
- Cool for R7 | i7: Four heat pipes and a copper base ensure optimal cooling performance for AMD R7 and Intel i7.
- Quiet Cooling Fan: SickleFlow 120 Edge with Dynamic PWM control (690–2,500 RPM), designed for low noise and peak cooling performance.
- Simplify Brackets: Redesigned brackets simplify installation on AM5 and LGA 1851|1700 platforms.
- Versatile Compatibility: 152mm tall design offers performance with wide chassis compatibility.
- Easy Installation: Easy to install with included thermal paste for hassle-free setup and optimal cooling performance.
Short bursts of high clock followed by sustained lower clocks
Many modern CPUs boost quickly (short-term limits) and then settle when long-term power budgets kick in. That “burst then flatline” behavior can look like throttling, even when it’s spec-compliant.
Power draw hits a ceiling and performance flattens
With Intel Power Gadget or similar telemetry, throttling-by-power usually shows package power leveling off near a limit while frequency can’t continue rising.
Independent reader supportYour contribution helps us test, update, and keep practical guides available for everyone.Troubleshooting when “throttling” indicators don’t line up
Utilization is low, but frequency drops anyway
Low utilization means the CPU may be idling or waiting on something (disk, network, GPU, synchronization). Throttling isn’t the likely explanation.
In that case, verify which processes are active in Task Manager > Processes and whether the system is truly CPU-bound.
Frequency charts look flat—counter collection issue
Sometimes Windows telemetry is coarse or your build/provider doesn’t expose Processor Frequency correctly. Try vendor tools for raw clocks and power.
Also confirm you’re actually watching the CPU selected in perfmon/task manager and not a different sensor view.
Thermal data is missing or blocked
Some sensor drivers are missing, blocked by BIOS settings, or not exposed through Windows. Vendor tools often work around this by reading platform registers directly.
If you only have built-in Windows data, rely on frequency-under-load as your primary throttling signal.
Quick wins for a faster PC:
Repair Windows errors before they cause bigger problemsFix Now →Scan for outdated or missing drivers - takes under a minuteDriver Scan →Windows shows 100% CPU but clocks never rise
If utilization is high but clocks stay low, it can still be throttling—just not thermal. It could be power plan maximum processor state settings, firmware limits, or a BIOS profile.
Best Value
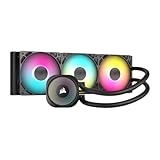
- Simple, High-Performance All-in-One CPU Cooling: Renowned CORSAIR engineering delivers strong, low-noise cooling that helps your CPU reach its full potential
- Efficient, Low-Noise Pump: Keeps your coolant circulating at a high flow rate while generating a whisper-quiet 20 dBA
- Convex Cold Plate with Pre-Applied Thermal Paste: The slightly convex shape ensures maximum contact with your CPU’s integrated heat spreader, with thermal paste applied in an optimised pattern to speed up installation
- RS120 ARGB Fans: RS ARGB fans create strong airflow and high static pressure, with easy ARGB control via a compatible motherboard. CORSAIR AirGuide technology and Magnetic Dome bearings ensure great cooling performance and low noise
- Easy Daisy-Chained Connections: Reduce the wiring in your system by daisy-chaining your RS ARGB fans and connecting them to just one 4-pin PWM fan header and one +5V ARGB header
Check power plan settings and vendor telemetry to see whether frequency is being capped by power/firmware rather than by temperature.
It’s not CPU throttling—check GPU, storage, or RAM bottlenecks
Performance slowdowns can be caused by GPU bottlenecks, storage latency, insufficient RAM, or driver issues. A CPU graph can look “busy” even when it can’t actually complete work faster.
If performance is poor but CPU frequency behavior doesn’t match throttling patterns, test with a CPU-focused benchmark and verify other subsystems are not saturating.
Recommended Free Tools
Common mistakes that lead to false conclusions
- Testing on battery when you meant to test AC behavior.
- Short runs that don’t last long enough to reveal sustained thermal/power limits.
- Ignoring background tasks (indexing, updates, antivirus scans) that change CPU load patterns.
- Comparing different power modes (Quiet vs Performance) or different BIOS profiles.
- Assuming throttling always means overheating—power caps and firmware limits can be the real limiter.
FAQs
Does Windows 10 show throttling directly?
No. Windows 10 typically shows utilization and frequency, but it usually doesn’t give a single “throttled” status label. Confirm throttling by correlating sustained load with frequency drops (and power/temperature signals when available).
What power plan setting should I change to reduce throttling?
Use Control Panel > Power Options and select High performance. If you see settings for Maximum processor state, ensure they’re not capped (common issues happen when max is set below 100%).
Is a frequency drop always bad?
Not necessarily. Many CPUs are designed to boost briefly and then run at a lower sustained frequency to meet thermal and power specifications. If performance matches expectations and the machine remains stable, it may be normal behavior rather than a problem.
How long should I test to catch throttling?
For thermal throttling, 10–20 minutes is a practical baseline. For power limit throttling, 5–10 minutes can be enough, but it depends on the CPU’s long-term budget behavior.
Can driver updates affect throttling readings?
Yes. Sensor drivers, chipset drivers, and vendor performance utilities can change what telemetry is available and how accurately power/frequency signals are reported. If readings change drastically after an update, verify with vendor tools.
Final Thoughts
To check CPU throttling on Windows 10, don’t hunt for a single checkbox. Use a repeatable workload, watch for sustained utilization with frequency drops, and—when you need certainty—confirm with Intel Power Gadget/XTU or AMD Ryzen Master.
If your CPU is throttling, the next step is usually straightforward: adjust power mode, validate cooling, update BIOS/chipset drivers, and verify whether the limiter is thermal, power, or firmware behavior.
Quick Recap
Product prices and availability are accurate as of the date/time indicated and are subject to change. Any price and availability information displayed on Amazon at the time of purchase will apply.




