Freedom251 › Manufacturing Analytics Software

Zoho Analytics
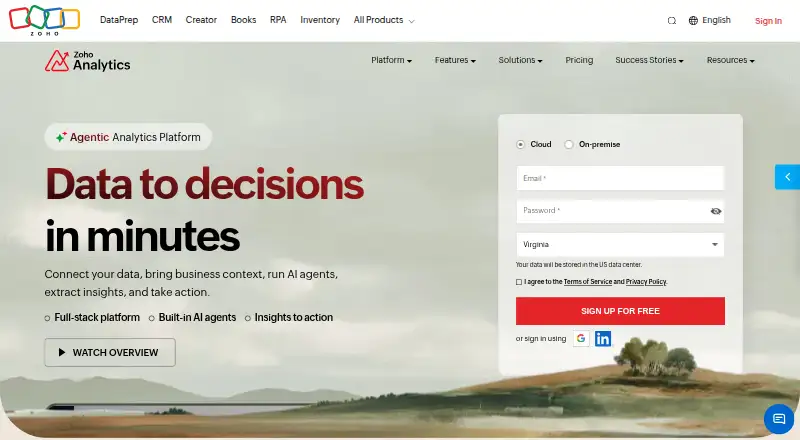
What Zoho Analytics is
Zoho Analytics is business intelligence software for connecting data, creating visualizations and sharing reports and dashboards. It connects and blends data from more than 500 live sources and lists over 500 out-of-the-box business integrations. Users can choose from 50+ chart types and 80+ visualization options, schedule reports, and apply permissions, roles, groups and row-level security. Ask Zia supports natural-language questions and actions. Security controls listed include SSO, audit logs, data masking and compliance controls. Native mobile apps provide access to analytics away from a desktop. Deployment options include cloud and on-premise, and the offering is described as hybrid. The Free plan provides two users, 10,000 rows, five workspaces, and unlimited reports and dashboards. Basic costs $24 a month when billed annually, starts at two users and 0.5 million rows, and includes unlimited workspaces. A 15-day trial can be canceled anytime. The listed headquarters are in Chennai, India, with U.S. headquarters in Austin, Texas.
Who it suits
Zoho Analytics may suit teams that need to combine data sources, build visualizations and share reports. Its permissions, row-level security, deployment options and mobile apps may suit organisations with varied access or hosting needs.
What it does well
- Connects and blends data from 500+ live sources
- Offers 50+ chart types and 80+ visualization options
- Includes row-level security and scheduled reports
- Free plan includes unlimited reports and dashboards
What to know first
- Free plan is limited to two users
- Free plan is limited to 10,000 rows
- Basic's listed price requires annual billing
Limits
The always-free plan allows two users, 10,000 rows, and five workspaces. Basic starts at two users and 0.5 million rows for $24.00 per month when billed annually.
Plans
| Plan | Billed and limits | Price |
|---|---|---|
| Free | Always Free Plan · 2 users · 10,000 rows · 5 workspaces | Free |
| Basic | billed annually · 2 users · 0.5M rows · Unlimited workspaces | $24 a month |
| Standard | Monthly · 5 users · 1M rows · Unlimited workspaces | On request |
| Premium | Monthly · 15 users · 5M rows · Unlimited workspaces | On request |
| Enterprise | Monthly · 50 users · 50M rows · Unlimited workspaces · 100,000 API units/day | On request |
| Dedicated Compute | 50 users · 500M rows | On request |
| Free Plan | — | Free |
As zoho.com lists them, read 21 Sept 2026. The maker's own page has the final word.
Getting started
- Visit the Zoho Analytics website.
- Start with the always-free plan or begin the 15-day trial.
- Choose cloud or on-premise deployment.
- Connect and blend data from supported sources.
- Build reports and dashboards, then set permissions for users.
Zoho Analytics is a business intelligence platform that brings together business data for analysis and reporting. It suits teams that need varied data connections, flexible sharing controls, and a choice of cloud or on-premise deployment. Its breadth is a strength, but the free plan’s small quotas and paid plans’ rising entry thresholds matter as usage grows.
Overview
More than 500 live data sources and 500+ business integrations give teams many routes to combine operational data. Reports can refresh hourly, and scheduled reporting supports recurring review. With 16,000 customers, 3 million users, and 75 million reports, the product has substantial adoption; those figures indicate reach, not a guarantee of fit for every organization.
Cloud and on-premise deployment options make it relevant to organizations with different hosting needs. Native mobile apps extend access beyond desktop use. The platform’s scale of connections and visual choices is useful, though teams should consider how much capacity they need before choosing a plan.
Key features
Analysis and sharing
More than 50 chart types and 80+ visualization options give analysts room to present findings in different forms. Embedded analytics can bring those outputs into other contexts, while Ask Zia supports natural-language questions and actions. These capabilities broaden how people can consume analysis, but do not remove the need for sound data and interpretation.
Governance
Permissions, roles, groups, and row-level security help limit access at different levels. SSO, audit logs, data masking, and compliance controls add useful safeguards for organizations managing sensitive information or multiple teams. These controls make the product a stronger candidate for governed reporting than a tool focused only on charts.
Pricing
The Free plan costs nothing and is an always-free plan. It allows 2 users, 10,000 rows, and 5 workspaces, with unlimited reports and dashboards. That is a practical way for a very small team to explore reporting, but the row cap can quickly constrain wider or growing datasets.
Basic costs $24 a month billed annually, starts at 2 users and 0.5 million rows, and includes unlimited workspaces. The larger row allowance and removal of the workspace cap make it a sensible step up for a small team, but the annual billing term is important to budget for. Local taxes are included in prices, though additional local taxes may also be charged.
Standard has custom pricing, starts at 5 users and 1 million rows, and includes unlimited workspaces. It fits teams needing more seats and capacity than Basic. Premium also has custom pricing, starts at 15 users and 5 million rows, and is aimed at larger groups with correspondingly greater data needs.
Enterprise has custom pricing and starts at 50 users and 50 million rows, with unlimited workspaces and 100,000 API units per day. Dedicated Compute uses customized plans, starts at 50 users and 500 million rows, and is for organizations with very large row requirements. Zoho Analytics offers a 15-day trial that can be canceled anytime; the free plan remains the lower-commitment option for small-scale use.
Platforms
Zoho Analytics supports cloud and on-premise deployment, with hybrid deployment options and a self-hosted platform category. Native mobile apps provide access to analytics on the move. The combination gives organizations hosting flexibility, although teams should choose based on their deployment requirements rather than assume every option works the same way.
Who it's for
It is a strong fit for teams consolidating data from many sources, distributing recurring reports, or controlling visibility across departments. The free plan suits small-scale evaluation and limited use; Basic is a clearer fit for small teams that need more rows and workspaces. Larger organizations may find the higher seat and row starting points appropriate, provided custom pricing fits their budget. It is less compelling for a solo user or a group whose data needs exceed the free cap but whose team cannot justify a paid tier.
Pros and cons
- Broad connectivity: 500+ live sources and 500+ integrations can reduce the friction of combining business data.
- Flexible presentation: 50+ chart types and 80+ visualization options support varied reporting needs.
- Granular governance: Roles, permissions, groups, row-level security, and security controls support controlled sharing.
- Restrictive free quota: Two users and 10,000 rows limit the free plan to modest workloads despite unlimited reports and dashboards.
- Higher-tier entry thresholds: Standard begins at 5 users and Premium at 15, so small teams may pay for capacity they do not yet need.
Alternatives
For people comparing specialist analytics categories, see HR Analytics Software, Manufacturing Analytics Software, Business Intelligence Tools, and Augmented Analytics Software.
Polinode is another freemium, web-based option. Consider Culture Amp, Lightcast, One Model, OneStream, Reejig, Workday Adaptive Planning, or Affirmity Employment Law Navigator when evaluating those products alongside Zoho Analytics.
Verdict
Choose Zoho Analytics if your team needs broad data connectivity, varied reporting, and meaningful access controls across cloud or on-premise environments. Its principal advantage is the combination of connection breadth and governance; its main drawback is that limited free capacity gives way to paid tiers with larger minimum seat counts. Small teams can start free, while growing organizations should weigh custom-tier capacity and annual Basic billing against their actual needs.
Verdict
Zoho Analytics offers broad data connections, visualization choices and access controls, with cloud and on-premise deployment options. Its free plan has user and row limits; Basic is listed at $24 a month when billed annually.
Questions
Is Zoho Analytics free?
Yes. Its always-free plan includes two users, 10,000 rows, five workspaces, and unlimited reports and dashboards.
How much does the Basic plan cost?
Basic is listed at $24.00 per month when billed annually. Prices include local taxes, though additional local taxes may also be charged.
Is there a free trial?
Yes. Zoho Analytics lists a 15-day trial that can be canceled anytime.
Can Zoho Analytics run on-premise?
Yes. Supported deployment options include cloud and on-premise, and the deployment is described as hybrid.
Does it have mobile apps and integrations?
It offers native mobile apps and lists more than 500 out-of-the-box business integrations, as well as connections to more than 500 live data sources.
Who makes Zoho Analytics?
The listed maker is Zoho Analytics. Zoho was founded in 1996 and lists headquarters in Chennai, India, and U.S. headquarters in Austin, Texas.
Facts from Zoho Analytics's own pages
- Business adoption
- Over 17,000 businesses choose Zoho Analytics as their BI partner · zoho.com, 28 Sept 2026
- Customer count
- 16 K customers · zoho.com, 28 Sept 2026
- Refresh frequency
- From 1/day to 24/day depending on plan · zoho.com, 28 Sept 2026
- Live data sources
- Connect and blend data from 500+ live sources · zoho.com, 28 Sept 2026
- Deployment
- hybrid · zoho.com, 21 Sept 2026
- Embedded analytics
- Analytics and AI agents can be embedded in business apps · zoho.com, 28 Sept 2026
- Founded
- 1996 · zoho.com, 23 Sept 2026
- Free plan
- Yes · zoho.com, 21 Sept 2026
- Free plan limits
- 2 users, 10K rows, 5 workspaces, unlimited reports and dashboards · zoho.com, 28 Sept 2026
- Free trial
- 15-day trial with no credit card required · zoho.com, 28 Sept 2026
- Headquarters
- Chennai, India; U.S. headquarters in Austin, Texas · zoho.com, 23 Sept 2026
- Business integrations
- 500+ out-of-the-box integrations · zoho.com, 28 Sept 2026
- Mobile apps
- Native mobile apps provide analytics access on the move · zoho.com, 28 Sept 2026
- Natural-language AI
- Ask Zia supports natural-language questions and actions · zoho.com, 28 Sept 2026
- Natural-language queries
- Yes · zoho.com, 21 Sept 2026
- Supported platforms
- Cloud and on-premise deployment · zoho.com, 28 Sept 2026
- Tax treatment
- Prices include local taxes, while additional local taxes may also be charged · zoho.com, 28 Sept 2026
- Refresh frequency
- hourly · zoho.com, 21 Sept 2026
- Report count
- 75 M reports · zoho.com, 28 Sept 2026
- Row-level security
- Yes · zoho.com, 21 Sept 2026
- Scheduled reports
- Yes · zoho.com, 21 Sept 2026
- Security controls
- SSO, audit logs, data masking, and compliance controls · zoho.com, 28 Sept 2026
- Sharing controls
- Fine-grained permissions, roles, groups, and row-level security · zoho.com, 28 Sept 2026
- Trial cancellation
- Trial can be canceled anytime · zoho.com, 28 Sept 2026
Where Zoho Analytics stands on Freedom251
- Manufacturing Analytics Software#2 of 29
- Business Intelligence Tools#12 of 89
- Financial Dashboards#3 of 20
- HR Analytics Software#4 of 25
- Support Analytics#4 of 25
- Business Intelligence & Analytics - Midmarket Software#6 of 25
- Ai Analytics#6 of 23
- Bi Platforms#8 of 29
- Self Service Analytics#7 of 24
- Business Analytics#8 of 26
- Business Intelligence & Analytics - Enterprise Software#9 of 29
- Agentic Analytics Software#7 of 22
- Dashboards#10 of 30
- Augmented Analytics Software#11 of 32
- Cloud Analytics Solutions#13 of 29
- Data Analytics Software#16 of 34