Freedom251 › Time Series Intelligence Software

VictoriaMetrics
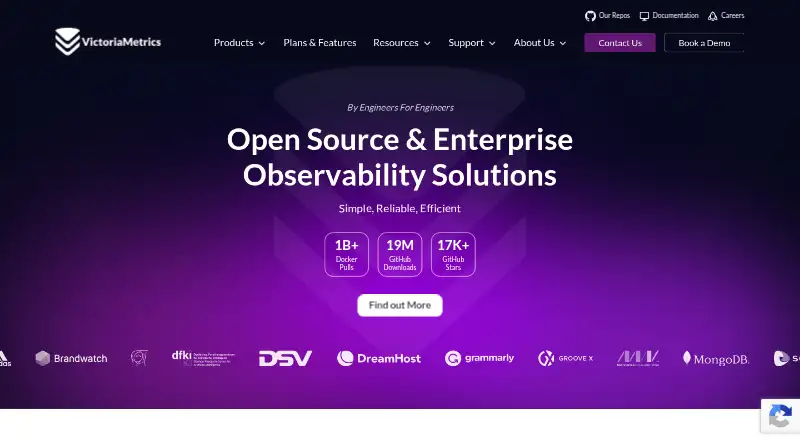
What VictoriaMetrics is
VictoriaMetrics is a time-series database and monitoring solution built for metrics ingestion, querying, and long-term storage. Its observability offering also covers logs and traces, with open-source, enterprise, and managed cloud options. Single-node and cluster open-source versions are listed as free. Deployments can be on-premises, hybrid, or cloud; VictoriaMetrics Cloud is managed and includes operations, automated backups, software updates, and dedicated resources. For metrics workflows, it supports Prometheus-compatible scraping and PromQL-compatible workflows, as well as MetricsQL. Listed ingestion methods include Prometheus scraping and remote write, InfluxDB line protocol, Graphite, OpenTSDB, DataDog, NewRelic, OpenTelemetry, Zabbix Connector, and others. Cloud pricing starts at $200 a month for both VictoriaMetrics and VictoriaLogs, with capacity tiers, deployment limits, and hourly usage metering; a free 30-day Cloud trial is advertised. Security features include TLS/HTTPS, JWT, LDAP, SSO, identity-provider integration, and mTLS between cluster components.
Who it suits
It suits teams and organizations choosing between self-hosted metrics monitoring and managed cloud observability. Enterprise tiers are described for small teams, growing businesses, platform teams, and organizations standardizing observability.
What it does well
- Open-source single-node and cluster versions
- Supports PromQL-compatible workflows and MetricsQL
- Offers on-premises, hybrid, and cloud deployment
- Cloud includes backups and software updates
- Free 30-day Cloud trial advertised
What to know first
- Cloud plans have capacity tiers and deployment limits
- Cloud usage is metered hourly
- Enterprise pricing is available on request
Limits
The open-source plan is for single-node or cluster metrics monitoring. VictoriaMetrics Cloud uses capacity tiers with deployment limits and hourly usage metering; its VictoriaMetrics and VictoriaLogs plans each start at $200 a month.
Plans
| Plan | Billed and limits | Price |
|---|---|---|
| VictoriaMetrics Open Source | Free; single-node and cluster versions are open source. · Single-node or cluster · metrics monitoring | Free |
| VictoriaMetrics Cloud — VictoriaMetrics | From $200/month. · 500k active time series · 16.6k datapoints/sec · 170 GB daily read volume · business-hours support included | $200 a month |
| VictoriaMetrics Cloud — VictoriaLogs | From $200/month. · 800 logs/sec · 0.8 MB/s ingestion · 50 new streams/24 hours · 4.6 GB/sec read rate · business-hours support included | $200 a month |
| VictoriaMetrics Enterprise | Ask for pricing. · Launchpad · Silver · Gold · Platinum · features and support vary by tier | On request |
As victoriametrics.com lists them, read 3 Oct 2026. The maker's own page has the final word.
Getting started
- Visit https://victoriametrics.com/.
- Choose the open-source single-node or cluster version, or review Cloud and Enterprise options.
- For Cloud, begin the advertised free 30-day trial or select a listed plan.
- Deploy on-premises, in a hybrid environment, or in the cloud.
- Configure a supported ingestion method and Prometheus-compatible or MetricsQL workflows.
VictoriaMetrics suits teams that need to collect and retain metrics across varied systems, especially those already using Prometheus-compatible workflows. Its strongest case is flexibility: self-managed open-source software sits alongside managed cloud and enterprise options, though Cloud’s starting prices and metered capacity make cost planning important.
Overview
VictoriaMetrics is a time-series database and monitoring solution designed for high ingest rates, fast queries, and long-term metrics storage. Its broader observability stack covers metrics, logs, and traces. Teams can deploy on-premises, in hybrid environments, or in the cloud, choosing open source, enterprise software, or the fully managed VictoriaMetrics Cloud.
Prometheus-compatible scraping and PromQL-compatible workflows make it a natural option for teams with existing Prometheus practices. MetricsQL provides another query language. VictoriaMetrics does not support SQL, so it is not the right fit when SQL querying is a requirement.
Key features
Collection and querying
Beyond Prometheus scraping, remote write, and exposition, ingestion options include InfluxDB line protocol, Graphite plaintext, OpenTSDB, JSON line, CSV, native binary, DataDog, NewRelic, OpenTelemetry, and a Zabbix Connector. This breadth helps teams bring data from different monitoring systems into one platform without relying on a single collection format. Grafana datasource support for logs adds another integration path.
Retention policies and horizontal scaling support long-lived metrics stores and growing workloads. Those capabilities suit teams balancing historical data needs with increasing ingestion, though the appropriate deployment and capacity depend on workload.
Operations and security
VictoriaMetrics Cloud includes managed operations, automated backups, software updates, and dedicated resources for each deployment. That reduces routine infrastructure work compared with self-management, but Cloud uses capacity tiers with deployment limits and hourly usage metering. Security features include TLS/HTTPS, JWT, LDAP, SSO, identity-provider integration, and mTLS between cluster components. Its information security management certifications comply with ISO/IEC 27001:2013 requirements.
Enterprise support includes expert technical support and guidance; community users have open-source community support options. The distinction matters for production teams that need help beyond community channels.
Pricing
Open-source and enterprise
VictoriaMetrics Open Source costs nothing, billed Free. It includes single-node and cluster versions for metrics monitoring, making it the clearest choice for teams willing to manage deployment themselves and work within open-source support options. VictoriaMetrics Enterprise has custom pricing, with Launchpad, Silver, Gold, and Platinum tiers whose features and support vary. It is aimed at teams ranging from small groups to organizations standardizing observability at production scale.
Managed Cloud
VictoriaMetrics Cloud — VictoriaMetrics starts at $200 a month and includes 500k active time series, 16.6k datapoints/sec, 170 GB daily read volume, and business-hours support. It fits metrics workloads within those capacity limits; teams should weigh the included allowances against hourly usage metering and tier deployment limits.
VictoriaMetrics Cloud — VictoriaLogs also starts at $200 a month. Its tier includes 800 logs/sec, 0.8 MB/s ingestion, 50 new streams/24 hours, a 4.6 GB/sec read rate, and business-hours support. These bounds make the plan more suitable for log workloads that fit the stated rates than for buyers who need unbounded capacity. The Cloud page advertises a free 30-day trial, giving teams a defined period to assess the managed service before committing.
Platforms
VictoriaMetrics supports API, Linux, macOS, self-hosted, web, and Windows environments. The range accommodates both managed-service users and teams operating their own deployments across common server and desktop platforms.
Who it's for
It is best suited to infrastructure and platform teams that need scalable metrics storage, want Prometheus-compatible collection and queries, or need to consolidate ingestion from multiple monitoring systems. Self-hosting is compelling for teams prioritizing control and avoiding a Cloud subscription; Cloud is better for those who value managed updates, backups, dedicated resources, and business-hours support. Teams requiring SQL or unwilling to monitor Cloud capacity and metered usage should consider another approach.
Pros and cons
Pros
- Open-source single-node and cluster editions cost nothing, giving self-managing teams a no-charge path.
- Prometheus compatibility plus MetricsQL and broad ingestion support helps accommodate mixed monitoring environments.
- Managed Cloud includes backups, updates, dedicated resources, and business-hours support in its starting tiers.
- Retention policies and horizontal scaling suit long-term metrics storage and expanding workloads.
Cons
- SQL is unsupported, ruling it out for workflows that depend on SQL queries.
- Cloud capacity tiers have deployment limits and hourly usage metering, requiring buyers to track both workload and cost.
- Enterprise pricing is custom, and features and support vary by tier, so buyers must establish fit with the applicable package.
Alternatives
Netdata is worth considering for buyers who want a freemium monitoring option with Android and iOS support; its Community plan is free but capped at five active connected nodes and one active custom dashboard per room.
Checkmk may suit teams seeking a free Community plan with 2000+ pre-built integrations, support for up to about 100 hosts, and community support.
Grafana Cloud Application Observability is an option for teams that prefer a hosted observability service with an always-free allowance of 2,232 host hours and a pay-as-you-go Pro plan.
Prometheus is a straightforward alternative for teams seeking a free, open-source monitoring and alerting toolkit under the Apache 2.0 license.
Akamai Cloud Longview is an alternative for buyers who want a free tier capped at 10 clients, five-minute data resolution, and 12 hours of data history.
Mackerel may fit smaller monitoring needs where a free plan with five standard and micro hosts total, 500 metrics, and one day of retention is sufficient.
Nagios XI is another monitoring option, with a free self-supported plan limited to seven nodes or 100 services, whichever comes first.
Pixie is a free alternative.
Verdict
Choose VictoriaMetrics if your team needs flexible, high-throughput metrics collection, Prometheus-compatible workflows, and a choice between self-managed open source and managed operations. Its open-source editions make it especially attractive to teams prepared to run the software themselves; look elsewhere if SQL is essential, or if Cloud’s capacity limits and hourly metering do not fit your workload or budgeting needs.
Verdict
VictoriaMetrics offers open-source and managed deployment paths for metrics, logs, and traces. Cloud buyers should review tier limits and hourly usage metering alongside the listed starting prices.
Questions
Is VictoriaMetrics open source?
Yes. Single-node and cluster versions are listed as open source and priced at $0.
Does VictoriaMetrics offer a free trial?
Yes. The VictoriaMetrics Cloud page advertises a free 30-day trial.
How much do the Cloud plans cost?
VictoriaMetrics Cloud and VictoriaLogs are each listed from $200 a month.
Which query languages does it support?
The listed query languages are MetricsQL and PromQL. VictoriaMetrics also describes PromQL-compatible workflows.
Can VictoriaMetrics be self-hosted?
Yes. Deployment options include on-premises and hybrid environments, as well as cloud.
Who makes VictoriaMetrics?
The maker is VictoriaMetrics, which says it was founded in 2018 by four engineers.
Facts from VictoriaMetrics's own pages
- Certifications
- The security page says its information security management certifications comply with ISO/IEC 27001:2013 requirements. · victoriametrics.com, 3 Oct 2026
- Cloud limits
- VictoriaMetrics Cloud uses capacity tiers with deployment limits and hourly usage metering; its page lists the included tier limits. · victoriametrics.com, 3 Oct 2026
- Cloud management
- VictoriaMetrics Cloud includes managed operations, automated backups, software updates, and dedicated resources for each deployment. · victoriametrics.com, 3 Oct 2026
- Cloud trial
- The Cloud page advertises a free 30-day trial. · victoriametrics.com, 3 Oct 2026
- Company
- VictoriaMetrics says it was founded by four engineers and builds open-source monitoring and observability software. · victoriametrics.com, 3 Oct 2026
- Deployment options
- The products support on-premises, hybrid, and cloud deployment, and VictoriaMetrics Cloud is a fully managed service. · victoriametrics.com, 3 Oct 2026
- Founded
- 2018 · victoriametrics.com, 28 Sept 2026
- Free plan
- Yes · docs.victoriametrics.com, 22 Sept 2026
- Integrations
- The plans and features page lists ingestion support for Influx, Graphite, OpenTSDB, RemoteWrite, DataDog, NewRelic, and OpenTelemetry, plus Grafana datasource support for logs. · victoriametrics.com, 3 Oct 2026
- Intended users
- The enterprise tiers are described for small teams, growing businesses and platform teams, production workloads at scale, and organizations standardizing observability. · victoriametrics.com, 3 Oct 2026
- Metrics database
- VictoriaMetrics is a time-series database and monitoring solution designed for high ingest rates, fast queries, and long-term metrics storage. · victoriametrics.com, 3 Oct 2026
- Product scope
- VictoriaMetrics describes an observability stack for metrics, logs, and traces, with open-source and enterprise offerings. · victoriametrics.com, 3 Oct 2026
- Prometheus compatibility
- VictoriaMetrics supports Prometheus-compatible scraping and PromQL-compatible workflows, and also provides MetricsQL. · victoriametrics.com, 3 Oct 2026
- Security
- VictoriaMetrics lists TLS/HTTPS, JWT, LDAP, SSO, identity-provider integration, and mTLS between cluster components among its security features. · victoriametrics.com, 3 Oct 2026
- SQL support
- No · docs.victoriametrics.com, 22 Sept 2026
- Support
- Enterprise support includes expert technical support and guidance, while community users have open-source community support options. · victoriametrics.com, 3 Oct 2026
Where VictoriaMetrics stands on Freedom251
- Time Series Intelligence Software#2 of 18
- Cloud Monitoring#13 of 31
- Kubernetes Monitoring#25 of 54
- Monitoring Observability#14 of 30
- Metrics Monitoring Tools#19 of 37
- Container Monitoring#31 of 49
- Time-Series Databases#24 of 36
- Database Software#54 of 74