Freedom251 › Database Monitoring
Grafana Cloud Application Observability
Visit Grafana Cloud Application Observability Alternatives Pricing
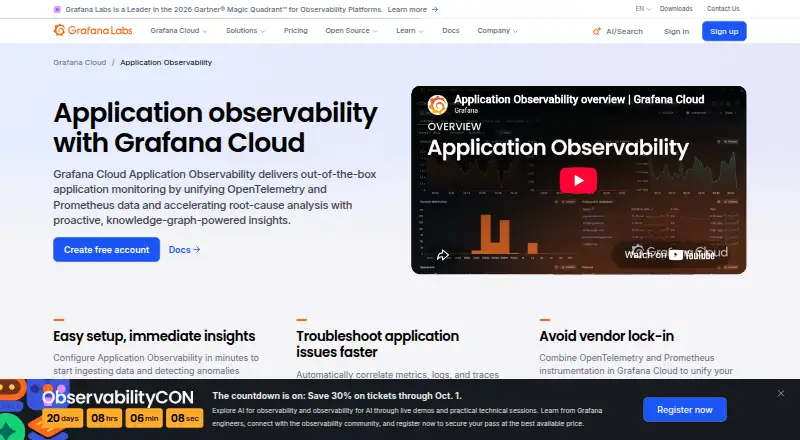
What Grafana Cloud Application Observability is
Grafana Cloud Application Observability monitors applications using OpenTelemetry and Prometheus data, helping software engineers investigate anomalies and root causes. Its knowledge graph discovers services and their relationships from telemetry, while the service catalog displays latency, error ratio, and request rate for each service. The RCA workbench and Entity Graph support investigation of correlated issues across a stack. Metrics, logs, traces, and profiles appear in a unified view, with paths from a service into its signals. Grafana identifies Alloy as a collector with native pipelines for OpenTelemetry and Prometheus. The free plan includes up to 2,232 host hours per month and community support. Pro is listed at $0.03 a month; billing details specify a $19 monthly platform fee and $0.025 per host hour, with pay-as-you-go charges above included usage. Application telemetry is also charged at standard Grafana Cloud rates, while serverless use is billed on ingested telemetry rather than host hours. The cloud product lists Linux, macOS, Windows, and web platforms.
Who it suits
It is aimed at software engineers who need to detect application anomalies, investigate causes, and address problems. It may suit teams already working with OpenTelemetry or Prometheus data.
What it does well
- Automatically discovers services and relationships.
- Service catalog displays latency, errors, and request rate.
- Unifies metrics, logs, traces, and profiles.
- Free plan includes up to 2,232 host hours monthly.
What to know first
- Free plan includes community support.
- Paid usage charges for host hours and telemetry.
- Serverless billing is based on ingested telemetry.
Limits
The Free plan includes up to 2,232 host hours per month and community support. Pro includes 2,232 host hours with its $19 monthly platform fee; usage above included amounts is pay as you go, and host hours and application telemetry are charged at standard Grafana Cloud rates.
Plans
| Plan | Billed and limits | Price |
|---|---|---|
| Free | Always free · 2,232 host hours/month · community support · no credit card | Free |
| Pro | $0.025/host hour ($18/host); $19/month platform fee · 50 GB ingested/month included · 30-day retention · 8×5 email support · automatic volume discounts | $0.03 a month |
| Enterprise | Custom pricing; minimum $25,000 annual commit · Premium support · public, federal, or bring-your-own-cloud deployment | On request |
As grafana.com lists them, read 14 Oct 2026. The maker's own page has the final word.
Getting started
- Visit the Grafana Cloud Application Observability website.
- Use the cloud service on Linux, macOS, Windows, or the web.
- Select the Free plan or Pro plan according to usage needs.
- Provide telemetry using OpenTelemetry or Prometheus; Grafana identifies Alloy as a collector with native pipelines for both.
Overview
Grafana Cloud Application Observability is a cloud application performance monitoring service for software engineers working to detect anomalies and trace application problems to their causes. Its strongest case is for teams that want service-level views across several telemetry types; host-hour charges and a separate telemetry billing basis for serverless workloads make usage worth watching.
Built to work with OpenTelemetry and Prometheus data, it connects metrics, logs, traces, and profiles in a shared investigative view. The service catalog and relationship map provide a starting point for following an issue across an application stack, rather than relying on disconnected signal-by-signal checks.
Key features
Service map and health
A knowledge graph automatically discovers services and their relationships from telemetry. The service catalog shows latency, error ratio, and request rate for each service, giving engineers a focused way to identify where performance is deteriorating and which connected services may matter.
Root-cause investigation
The RCA workbench and Entity Graph help investigate correlated issues across a stack. Distributed tracing, transaction tracing, dependency mapping, and log correlation add useful context for multi-service investigations. Teams with only a small, straightforward application may not need this breadth.
Shared telemetry and alerting
Users can drill from a service into its metrics, logs, traces, and profiles. Grafana says the product is compatible with OpenTelemetry and Prometheus, and identifies Alloy as a collector with native pipelines for both. Alert deduplication, routing rules, enrichment, and suppression round out the alert capabilities; these are relevant to teams managing recurring, cross-service signals, not a substitute for evaluating their own alert workflows.
Pricing
The pricing model is freemium. The Free plan costs nothing, is always free, and includes up to 2,232 host hours per month with community support. It is a practical way to start with the service, but the host-hour allowance bounds its fit for sustained or larger workloads.
Pro is priced at $0.03 a month, with billing of $0.025 per host hour and a $19 monthly platform fee. The fee includes 2,232 host hours; usage above included usage is pay as you go. This gives teams a paid route beyond the free allocation, but the platform fee and variable overage mean the displayed starting price alone is not the full cost basis.
Enterprise has custom pricing and includes full service, premium support, and deployment flexibility. It is the option for organizations that need those terms rather than a fixed published price. Application Observability charges for host hours and application telemetry at standard Grafana Cloud rates; serverless usage is billed on telemetry ingested rather than host hours, an important distinction when estimating costs.
Platforms
Grafana lists Linux, macOS, web, and Windows platforms. The deployment model is cloud, so this is not a self-hosted deployment choice.
Who it's for
This is best suited to software engineers responsible for application performance across connected services, particularly teams already using OpenTelemetry or Prometheus. Service discovery, RED metrics, and correlated-signal investigation make it a stronger fit for diagnosing distributed applications than for buyers seeking only a narrow database monitor or a simple standalone alert tool.
Pros and cons
- Pro: Metrics, logs, traces, and profiles share an investigative view, helping teams follow an issue from service health into related signals.
- Pro: The knowledge graph, service catalog, RCA workbench, and Entity Graph support service-level and cross-stack investigation.
- Pro: The free plan includes 2,232 host hours per month, allowing teams to begin without a subscription charge.
- Con: Pro combines a $19 monthly platform fee with host-hour charges and pay-as-you-go usage above the included amount, so costs can rise with use.
- Con: Serverless billing is based on ingested telemetry rather than host hours, which requires a different usage estimate.
- Con: The Free plan includes community support, while Enterprise is the plan that specifies premium support.
Alternatives
For database-focused monitoring, DBmarlin is a freemium alternative with a free plan. pgwatch is a free, self-hosted option for PostgreSQL environments, while Percona Monitoring and Management is a free, open-source database monitoring and management choice whose installation infrastructure may have separate costs. Choose MySQL when the need is a database platform with SQL and NoSQL applications plus replication and high-availability components, rather than application-wide observability.
Amazon RDS and Google Cloud SQL are database services to consider when the priority is managed cloud databases rather than a shared application telemetry view. For SQL Server tuning specifically, AI SQL Tuner Studio has a free plan limited to SQL Server Developer Edition. AimBetter is another database-monitoring alternative, with starting per-server pricing of $110 a month.
Readers comparing adjacent categories can also explore Database Performance Monitoring Software, On-Call Management Software, Alert Management Software, Profiling Software, IT Incident Management Software, and Distributed Tracing Tools.
Verdict
Grafana Cloud Application Observability is a strong choice for engineering teams that need to investigate application behavior across services and telemetry types, especially when OpenTelemetry or Prometheus is already part of their workflow. Its service map, health metrics, and correlated investigation tools are the central reasons to choose it. Look elsewhere if you need a self-hosted deployment or cannot accommodate host-hour and telemetry-based usage costs.
Verdict
Grafana Cloud Application Observability brings several telemetry types and service-level views together for application investigation. Review the included host hours and billing basis, especially for serverless environments, before choosing a plan.
Questions
Is there a free plan?
Yes. The Free plan is billed at no cost and includes up to 2,232 host hours per month, with community support.
How is the Pro plan priced?
The listed Pro price is $0.03 a month. Its billing details state $0.025 per host hour, a $19 monthly platform fee, 2,232 host hours included with that fee, and pay-as-you-go charges above included usage.
How is serverless usage billed?
For serverless environments, usage is billed on telemetry ingested rather than host hours.
Which telemetry formats does it support?
Grafana says Application Observability is compatible with OpenTelemetry and Prometheus. It identifies Alloy as a collector with native pipelines for both.
Which platforms are supported?
The listed platforms are Linux, macOS, web, and Windows.
What compliance information is listed?
The product page lists FedRAMP compliance, NATSEC100 certification, PCI DSS compliance, A-LIGN certification, AICPA SOC Type II verification, and GDPR compliance.
Facts from Grafana Cloud Application Observability's own pages
- Automatic anomaly detection
- Automatic baselines and knowledge-graph analysis detect saturation, anomalies, failures, and errors without custom queries or alert rules. · grafana.com, 14 Oct 2026
- Beyla requirement
- Grafana Beyla auto-instrumentation works without code changes but requires Linux kernel 5.8 or newer with BTF enabled. · grafana.com, 14 Oct 2026
- Billing
- Application Observability charges for host hours and for application telemetry at standard Grafana Cloud rates. · grafana.com, 29 Sept 2026
- Company
- Grafana Labs lists its headquarters as New York, New York, USA, and its founding year as 2014. · grafana.com, 29 Sept 2026
- Company founded
- Grafana Labs was founded in 2014 by Raj Dutt, Anthony Woods, and Torkel Ödegaard. · linkedin.com, 14 Oct 2026
- Company legal name
- Crunchbase lists Grafana Labs’ legal name as Raintank, Inc. · crunchbase.com, 14 Oct 2026
- Developer tooling
- Developer resources include Grafana CLI, Foundation SDK, observability-as-code, Git Sync, and CI/CD dashboard provisioning. · grafana.com, 14 Oct 2026
- Documentation depth
- The documentation covers setup, instrumentation, pricing, cost optimization, troubleshooting, APIs, SDKs, dashboards, integrations, and signal exploration. · grafana.com, 14 Oct 2026
- Founded
- 2014 · grafana.com, 28 Sept 2026
- Free plan
- Yes · grafana.com, 23 Sept 2026
- Free usage limit
- The free Application Observability plan includes up to 2,232 host hours per month and community support. · grafana.com, 29 Sept 2026
- Instrumentation options
- Supported approaches include Grafana Java and .NET distributions, upstream JavaScript/Python/PHP/Go SDKs, Beyla eBPF, and the OpenTelemetry Operator. · grafana.com, 14 Oct 2026
- Integrations
- Grafana Cloud connection tiles support Java, .NET, Beyla, Grafana Alloy, OTLP, and the upstream OpenTelemetry Collector. · grafana.com, 14 Oct 2026
- License
- The Grafana open-source project is distributed under AGPL-3.0-only, with listed Apache-2.0 exceptions; Grafana Cloud itself is a managed service. · github.com, 14 Oct 2026
- Limit: Android app scope
- The official Android app requires a Grafana Cloud account and does not support Grafana OSS. · play.google.com, 14 Oct 2026
- Limit: AWS Marketplace reviewers
- Reviewers report configuration complexity, steep expertise requirements, non-real-time alerting at times, and maintenance overhead from extensive customization. · aws.amazon.com, 14 Oct 2026
- Limit: billing identity
- Services missing supported OpenTelemetry host identifiers are excluded from host-hour billing and receive a configuration warning. · grafana.com, 14 Oct 2026
- Limit: G2 learning curve
- G2 reviewers repeatedly report steep learning curves, complex setup, and difficult query configuration. · g2.com, 14 Oct 2026
- Limit: Gartner pricing
- Gartner’s displayed dislikes repeatedly identify cost as a problem. · gartner.com, 14 Oct 2026
- Limit: iOS alert sounds
- An App Store reviewer requested custom alert ringtones because built-in sounds were not loud enough for on-call use. · apps.apple.com, 14 Oct 2026
- Limit: TrustRadius alerting
- TrustRadius reviewers mention limited baseline or anomaly alerting, insufficient data transformation, and complexity for advanced setups. · trustradius.com, 14 Oct 2026
- OpenTelemetry compatibility
- Applications can send OTLP telemetry using Grafana or upstream OpenTelemetry SDKs and collectors. · grafana.com, 14 Oct 2026
- Praise: AWS Marketplace reviewers
- Reviewers praise unified dashboards, broad data-source integrations, customization, and alerting. · aws.amazon.com, 14 Oct 2026
- Praise: G2 dashboards
- G2 reviewers repeatedly praise flexible, intuitive dashboards and real-time visualization. · g2.com, 14 Oct 2026
Where Grafana Cloud Application Observability stands on Freedom251
- Database Monitoring#2 of 38
- Time Series Intelligence Software#1 of 18
- On-Call Management Software#2 of 30
- Synthetic Monitoring#3 of 43
- Site Reliability Engineering Platforms#1 of 13
- Application Performance & Observability - Enterprise Software#3 of 26
- Database Performance Monitoring Software#3 of 25
- Distributed Tracing Tools#4 of 32
- AWS Marketplace Software#4 of 31
- Observability Platforms#4 of 30
- Monitoring Observability#4 of 30
- Real User Monitoring#4 of 29
- Kubernetes Monitoring#9 of 54
- Profiling Software#5 of 29
- IT Alerting Software#4 of 23
- Application Performance Monitoring#7 of 37
- Cloud Monitoring#6 of 31
- Log Management Software#22 of 111
- Continuous Profiling Tools#6 of 30
- Incident Management Software#6 of 29
- Runtime Monitoring Software#12 of 56
- Metrics Monitoring Tools#8 of 37
- Application Performance & Observability - Midmarket Software#6 of 26
- IT Incident Management Software#8 of 31
- Log Monitoring Tools#9 of 28
- Log Analysis Software#8 of 24