Freedom251 › Disk Health Monitoring Software
smartctl_exporter
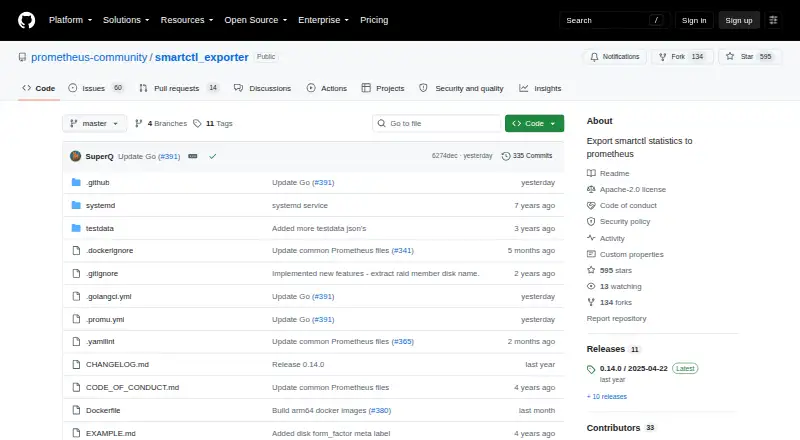
What smartctl_exporter is
smartctl_exporter is a free exporter for sending SMART statistics from smartctl to Prometheus. It reads smartctl’s JSON output and requires smartmontools version 7.0 or later. When you do not specify devices, it scans the system for available ones and can rescan as devices appear or disappear. Its default metrics endpoint is /metrics, and it listens on port 9633 by default. On Linux, it can use systemd socket activation instead of port listeners. TLS and basic authentication are available through a web configuration file. The project supports Linux and self-hosted deployment, and lists control-plane monitoring and managed Kubernetes support. Listed data retention is 10 days. Device access such as SATA access can require smartctl to run as root; the project’s Docker Compose example uses its image in privileged mode as root. The repository identifies the license as Apache-2.0. The Free plan costs nothing. Version 0.15.0 lists additional temperature values, endurance and verify-error metrics, and support for NVMe devices behind bridges.
Who it suits
It suits Linux users who want to expose SMART statistics to Prometheus, including self-hosted and managed Kubernetes environments. It can also suit operators who need device discovery and configurable TLS or basic authentication.
What it does well
- Exports smartctl statistics to Prometheus.
- Scans for devices and can rescan for changes.
- Supports TLS and basic authentication.
- Linux support includes systemd socket activation.
- Apache-2.0 license and a free plan.
What to know first
- Requires smartmontools version 7.0 or later.
- Device access such as SATA access can require root.
- Listed data retention is 10 days.
Limits
The Free plan is listed as free and requires smartmontools version 7.0 or later. Listed data retention is 10 days.
Plans
| Plan | Billed and limits | Price |
|---|---|---|
| Free | Open-source exporter; requires smartmontools ≥ 7.0 | Free |
As github.com lists them, read 7 Oct 2026. The maker's own page has the final word.
Getting started
- Install smartmontools version 7.0 or later.
- Run smartctl_exporter on Linux or in a self-hosted deployment.
- Allow device access; smartctl may need to run as root.
- Configure Prometheus to use the default /metrics endpoint on port 9633.
- Optionally configure TLS and basic authentication through the web configuration file.
Verdict
Choose smartctl_exporter if you need a free Linux exporter for SMART statistics in Prometheus and can meet its smartmontools requirement. Device access may require root, so account for that when planning deployment.
Questions
How much does smartctl_exporter cost?
The Free plan costs nothing.
Is smartctl_exporter open source?
Yes. The repository identifies its license as Apache-2.0.
What does it integrate with?
It exports smartctl statistics to Prometheus.
Which platforms does it support?
The listed platforms are Linux and self-hosted deployment. The project also lists managed Kubernetes support.
What does it require?
It uses JSON output from smartctl and requires smartmontools version 7.0 or later. Device access, including SATA access, can require smartctl to run as root.
What are the default metrics address and path?
The default metrics path is /metrics, and the default listening port is 9633.
Facts from smartctl_exporter's own pages
- Access requirement
- The README says smartctl needs to run as root for device access such as SATA access. · github.com, 7 Oct 2026
- Data source
- The exporter uses JSON output from smartctl and requires smartmontools version 7.0 or later. · github.com, 7 Oct 2026
- Deployment
- The README provides a Docker Compose example using the prometheuscommunity/smartctl-exporter image, privileged mode, and root user. · github.com, 7 Oct 2026
- Device discovery
- It scans the system for available devices by default when no devices are specified, and can rescan for devices that appear or disappear. · github.com, 7 Oct 2026
- Latest release
- The releases page lists version 0.15.0, dated 2026-09-01, with release assets and source archives. · github.com, 7 Oct 2026
- License
- The repository identifies its license as Apache-2.0. · github.com, 7 Oct 2026
- Linux feature
- On Linux, it can use systemd socket activation instead of port listeners. · github.com, 7 Oct 2026
- Metrics endpoint
- The default metrics path is /metrics and the default listen address uses port 9633. · github.com, 7 Oct 2026
- Prometheus integration
- The project describes its purpose as exporting smartctl statistics to Prometheus. · github.com, 7 Oct 2026
- Purpose
- smartctl_exporter exports smartctl statistics to Prometheus. · github.com, 7 Oct 2026
- Recent features
- Version 0.15.0 lists additional temperature values, endurance and verify-error metrics, and handling for NVMe devices behind bridges. · github.com, 7 Oct 2026
- Security
- The exporter supports TLS and basic authentication through a web configuration file. · github.com, 7 Oct 2026
- Security reporting
- The project directs security issue reports to the Prometheus security policy. · github.com, 7 Oct 2026
- Support
- The README invites users to file a feature request with the desired metric and exported smartctl JSON data. · github.com, 7 Oct 2026
Where smartctl_exporter stands on Freedom251
- Disk Health Monitoring Software#18 of 30